

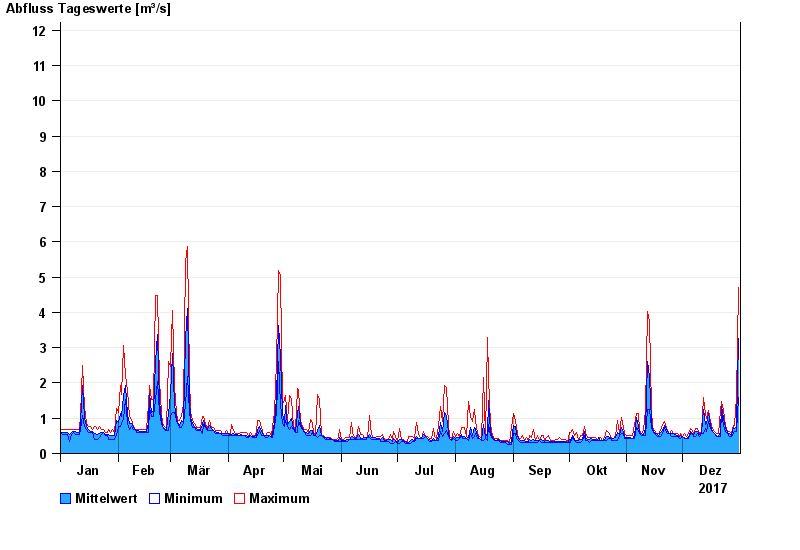
Chart of year Kinning / Rott
Discharge from 01.01.2017 to 31.12.2017
- HQ1 18,6 m³/s
- HQ2 25 m³/s
- HQ5 33 m³/s
- HQ10 39 m³/s
- HQ20 45 m³/s
- HQ50 53 m³/s
- HQ100 59 m³/s
| Date | Mean value [m³/s] | Maximum [m³/s] | Minimum [m³/s] |
|---|---|---|---|
| 31.12.2017 | 3.25 | 4.7 | 1.58 |
| 30.12.2017 | 0.755 | 1.58 | 0.631 |
| 29.12.2017 | 0.703 | 0.803 | 0.632 |
| 28.12.2017 | 0.726 | 0.803 | 0.555 |
| 27.12.2017 | 0.502 | 0.555 | 0.483 |
| 26.12.2017 | 0.572 | 0.633 | 0.483 |
| 25.12.2017 | 0.599 | 0.633 | 0.555 |
© Bayerisches Landesamt für Umwelt 2024