
- Start >
- Rivers >
- Discharge >
- Isar >
- Hohenkammer >
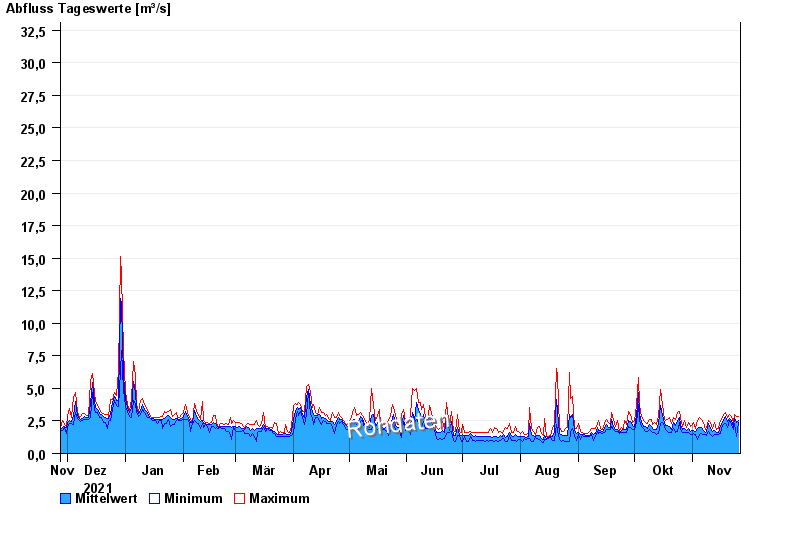
- Chart of year

Chart of year Hohenkammer / Glonn
Discharge from 27.11.2021 to 26.11.2022
- HQ1 33 m³/s
- HQ2 41 m³/s
- HQ5 52 m³/s
- HQ10 66 m³/s
- HQ20 80 m³/s
- HQ50 100 m³/s
- HQ100 115 m³/s
| Date | Mean value [m³/s] | Maximum [m³/s] | Minimum [m³/s] |
|---|---|---|---|
| 26.11.2022 | 2.52 | 2.87 | 2.41 |
| 25.11.2022 | 2.4 | 2.87 | 1.31 |
| 24.11.2022 | 2.72 | 3 | 2.3 |
| 23.11.2022 | 2.1 | 2.41 | 1.81 |
| 22.11.2022 | 2.5 | 2.87 | 2.2 |
| 21.11.2022 | 2.72 | 3 | 2.52 |
| 20.11.2022 | 2.44 | 2.75 | 2 |
© Bayerisches Landesamt für Umwelt 2024