
- Start >
- Rivers >
- Discharge >
- Isar >
- Hohenkammer >
- Chart of year

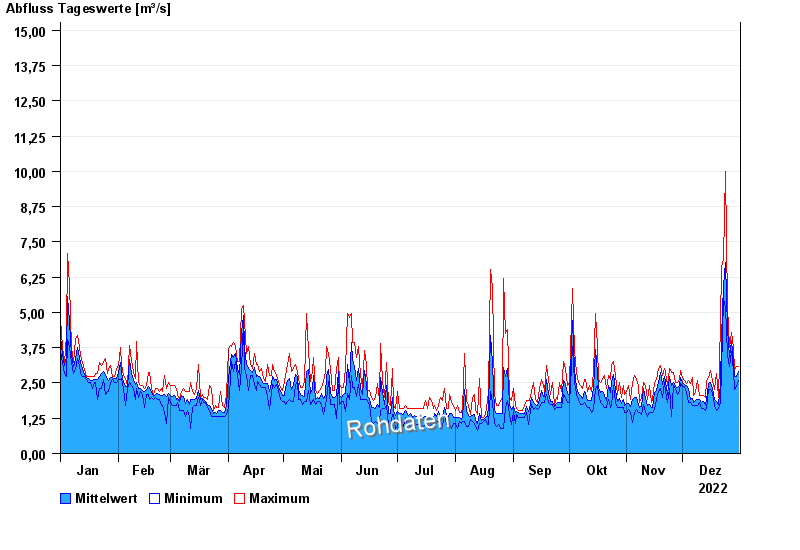
Chart of year Hohenkammer / Glonn
Discharge from 01.01.2022 to 31.12.2022
- 31.05.1940 Abfluss: 116 m³/s
- 14.04.1994 Abfluss: 109 m³/s
- 11.09.1940 Abfluss: 78,3 m³/s
- 11.03.2006 Abfluss: 72,4 m³/s
- 21.01.1951 Abfluss: 71,4 m³/s
| Date | Mean value [m³/s] | Maximum [m³/s] | Minimum [m³/s] |
|---|---|---|---|
| 31.12.2022 | 2.92 | 3.08 | 2.6 |
| 30.12.2022 | 2.73 | 3.08 | 2.38 |
| 29.12.2022 | 2.74 | 2.95 | 2.28 |
| 28.12.2022 | 3.25 | 3.74 | 2.95 |
| 27.12.2022 | 4.02 | 4.3 | 3.6 |
| 26.12.2022 | 3.39 | 3.74 | 3.08 |
| 25.12.2022 | 4.43 | 5.19 | 3.46 |
© Bayerisches Landesamt für Umwelt 2024