
- Start >
- Rivers >
- Discharge >
- Isar >
- Hohenkammer >
- Chart of year

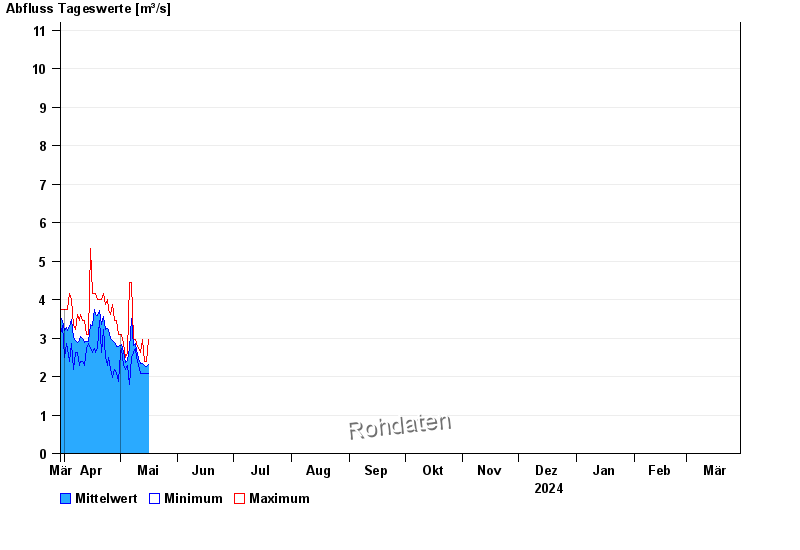
Chart of year Hohenkammer / Glonn
Discharge from 30.03.2024 to 29.03.2025
- HQ1 33 m³/s
- HQ2 41 m³/s
- HQ5 52 m³/s
- HQ10 66 m³/s
- HQ20 80 m³/s
- HQ50 100 m³/s
- HQ100 115 m³/s
| Date | Mean value [m³/s] | Maximum [m³/s] | Minimum [m³/s] |
|---|---|---|---|
| 10.05.2024 | 2.67 | 2.85 | 2.5 |
| 09.05.2024 | 2.87 | 2.97 | 2.73 |
| 08.05.2024 | 2.8 | 2.97 | 2.62 |
| 07.05.2024 | 3.52 | 4.44 | 2.5 |
| 06.05.2024 | 2.73 | 4.44 | 1.79 |
| 05.05.2024 | 2.42 | 2.62 | 2.29 |
| 04.05.2024 | 2.36 | 2.5 | 2.19 |
© Bayerisches Landesamt für Umwelt 2024