
- Start >
- Rivers >
- Discharge >
- Isar >
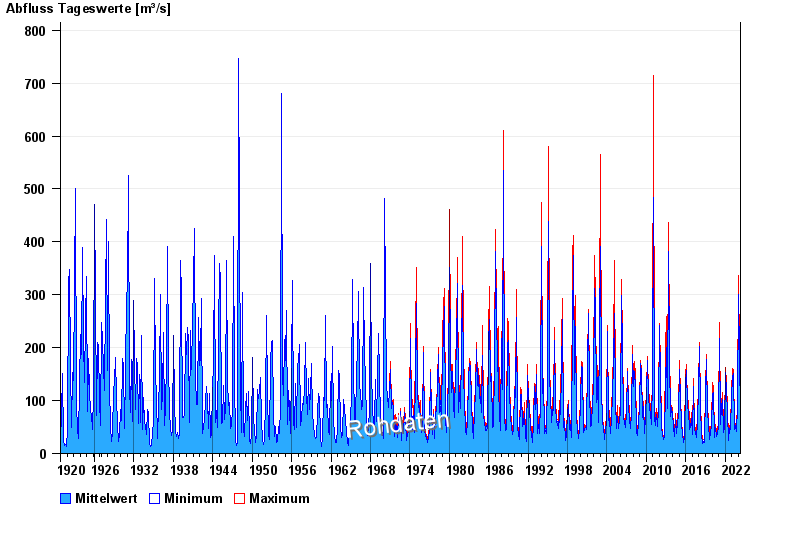
- Heitzenhofen >
- Chart of total period

Chart of total period Heitzenhofen / Naab
Discharge from 01.11.1920 to 26.04.2024
| Date | Mean value [m³/s] | Maximum [m³/s] | Minimum [m³/s] |
|---|---|---|---|
| 26.04.2024 | 53.5 | 55.5 | 51.1 |
| 25.04.2024 | 59.1 | 63.4 | 55.5 |
| 24.04.2024 | 68.1 | 73 | 63.4 |
| 23.04.2024 | 74.5 | 80.1 | 72.3 |
| 22.04.2024 | 79.4 | 81.6 | 76.5 |
| 21.04.2024 | 69.4 | 76.5 | 61.4 |
| 20.04.2024 | 52.3 | 61.4 | 46.9 |
© Bayerisches Landesamt für Umwelt 2024