
- Start >
- Rivers >
- Discharge >
- Isar >
- Haunstetten >
- Chart of year

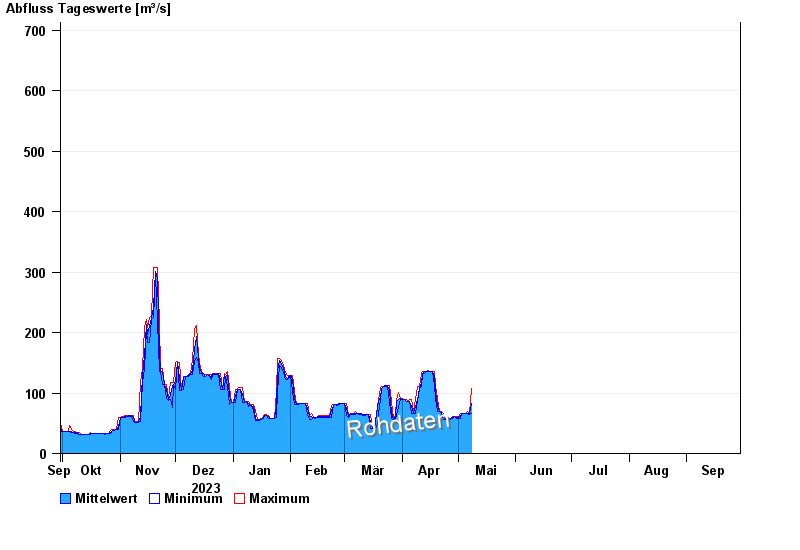
Chart of year Haunstetten / Lech
Discharge from 30.09.2023 to 29.09.2024
 Für diesen Pegel sind keine Jährlichkeiten hinterlegt.
| Date | Mean value [m³/s] | Maximum [m³/s] | Minimum [m³/s] |
|---|---|---|---|
| 27.04.2024 | 58.5 | 58.5 | 58.5 |
| 26.04.2024 | 58.5 | 58.5 | 58.5 |
| 25.04.2024 | 58.4 | 58.5 | 56.7 |
| 24.04.2024 | 57.1 | 58.5 | 56.7 |
| 23.04.2024 | 57.7 | 66.8 | 56.7 |
| 22.04.2024 | 67.4 | 68.9 | 66.8 |
| 21.04.2024 | 68.9 | 68.9 | 68.9 |
© Bayerisches Landesamt für Umwelt 2024