
- Start >
- Rivers >
- Discharge >
- Isar >
- Haunstetten >
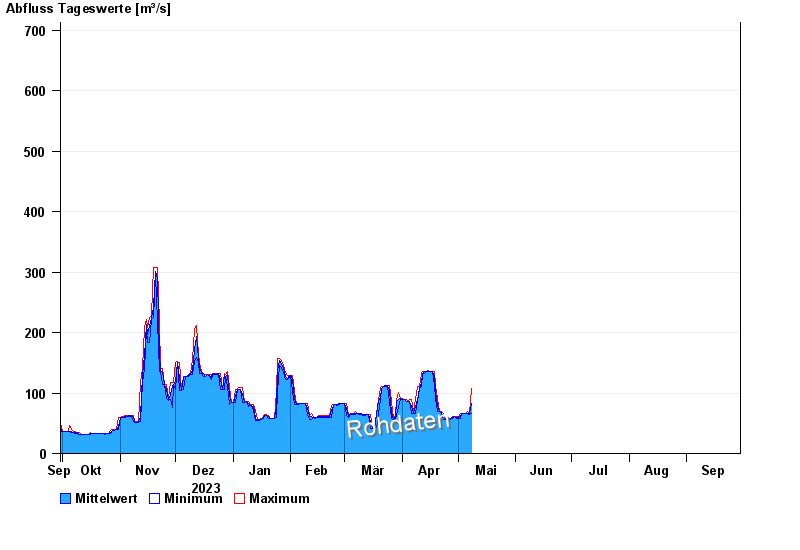
- Chart of year

Chart of year Haunstetten / Lech
Discharge from 30.09.2023 to 29.09.2024
 Für diesen Pegel sind keine Jährlichkeiten hinterlegt.
| Date | Mean value [m³/s] | Maximum [m³/s] | Minimum [m³/s] |
|---|---|---|---|
| 24.05.2024 | 129 | 129 | 129 |
| 23.05.2024 | 117 | 132 | 108 |
| 22.05.2024 | 108 | 108 | 108 |
| 21.05.2024 | 109 | 110 | 108 |
| 20.05.2024 | 109 | 110 | 108 |
| 19.05.2024 | 127 | 132 | 110 |
| 18.05.2024 | 132 | 132 | 129 |
© Bayerisches Landesamt für Umwelt 2024