

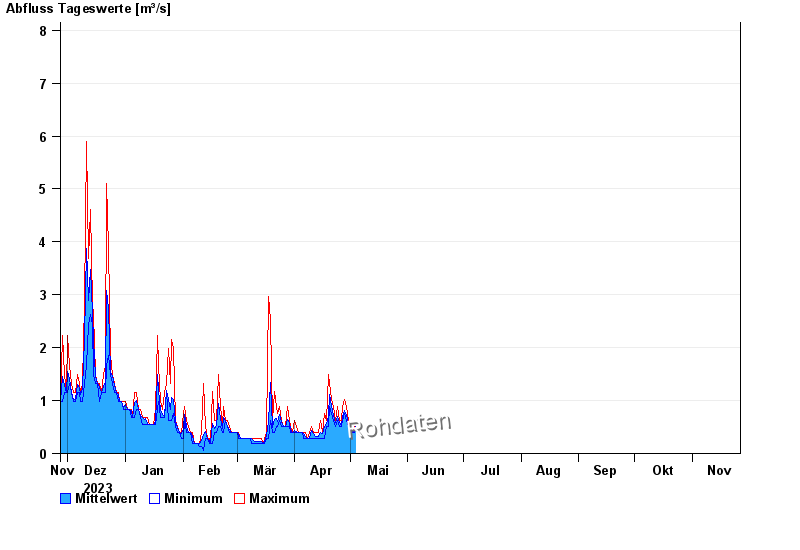
Chart of year Hammer / Oberteisendorfer Ache
Discharge from 27.11.2023 to 26.11.2024
- 04.08.2020 Abfluss: 46,5 m³/s
- 11.06.1971 Abfluss: 32,5 m³/s
- 12.08.2002 Abfluss: 32,2 m³/s
- 10.06.1965 Abfluss: 31,4 m³/s
- 26.06.1995 Abfluss: 25 m³/s
| Date | Mean value [m³/s] | Maximum [m³/s] | Minimum [m³/s] |
|---|---|---|---|
| 18.05.2024 | 0.26 | 0.26 | 0.26 |
| 17.05.2024 | 0.247 | 0.26 | 0.173 |
| 16.05.2024 | 0.237 | 0.26 | 0.173 |
| 15.05.2024 | 0.26 | 0.26 | 0.26 |
| 14.05.2024 | 0.26 | 0.26 | 0.26 |
| 13.05.2024 | 0.26 | 0.26 | 0.26 |
| 12.05.2024 | 0.318 | 0.362 | 0.26 |
© Bayerisches Landesamt für Umwelt 2024