
- Start >
- Rivers >
- Discharge >
- Isar >
- Großschwindau >
- Chart of year

Chart of year Großschwindau / Goldach
Discharge from 22.02.2021 to 21.02.2022
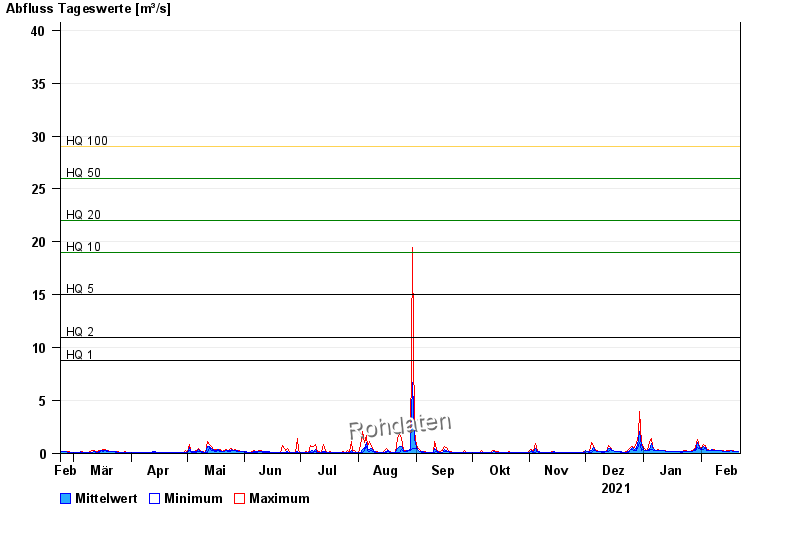
- HQ1 8,8 m³/s
- HQ2 11 m³/s
- HQ5 15 m³/s
- HQ10 19 m³/s
- HQ20 22 m³/s
- HQ50 26 m³/s
- HQ100 29 m³/s
| Date | Mean value [m³/s] | Maximum [m³/s] | Minimum [m³/s] |
|---|---|---|---|
| 21.02.2022 | 0.17 | 0.2 | 0.166 |
| 20.02.2022 | 0.173 | 0.2 | 0.166 |
| 19.02.2022 | 0.2 | 0.2 | 0.2 |
| 18.02.2022 | 0.23 | 0.237 | 0.2 |
| 17.02.2022 | 0.248 | 0.277 | 0.237 |
| 16.02.2022 | 0.217 | 0.237 | 0.2 |
| 15.02.2022 | 0.213 | 0.237 | 0.2 |
© Bayerisches Landesamt für Umwelt 2024