
- Start >
- Rivers >
- Discharge >
- Isar >
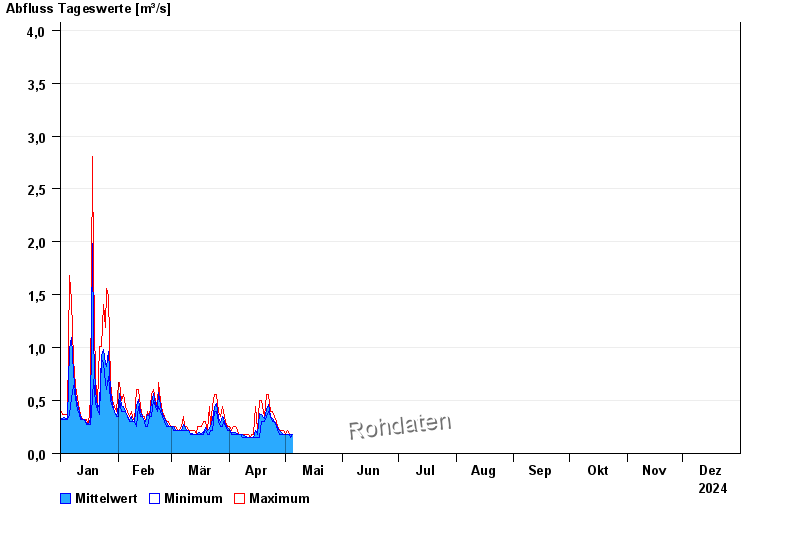
- Großschwindau >
- Chart of year

Chart of year Großschwindau / Goldach
Discharge from 01.01.2024 to 31.12.2024
- 15.02.1990 Abfluss: 22,5 m³/s
- 03.08.1991 Abfluss: 22,1 m³/s
- 01.08.1991 Abfluss: 21,8 m³/s
- 09.06.1965 Abfluss: 20,1 m³/s
- 22.06.1965 Abfluss: 19,5 m³/s
| Date | Mean value [m³/s] | Maximum [m³/s] | Minimum [m³/s] |
|---|---|---|---|
| 26.05.2024 | 0.262 | 0.3 | 0.258 |
| 25.05.2024 | 0.326 | 0.445 | 0.258 |
| 24.05.2024 | 0.461 | 0.915 | 0.3 |
| 23.05.2024 | 0.301 | 0.915 | 0.18 |
| 22.05.2024 | 0.274 | 0.393 | 0.18 |
| 21.05.2024 | 0.172 | 0.345 | 0.147 |
| 20.05.2024 | 0.172 | 0.18 | 0.147 |
© Bayerisches Landesamt für Umwelt 2024