
- Start >
- Rivers >
- Discharge >
- Isar >
- Großschwindau >
- Chart of year

Chart of year Großschwindau / Goldach
Discharge from 29.03.2024 to 28.03.2025
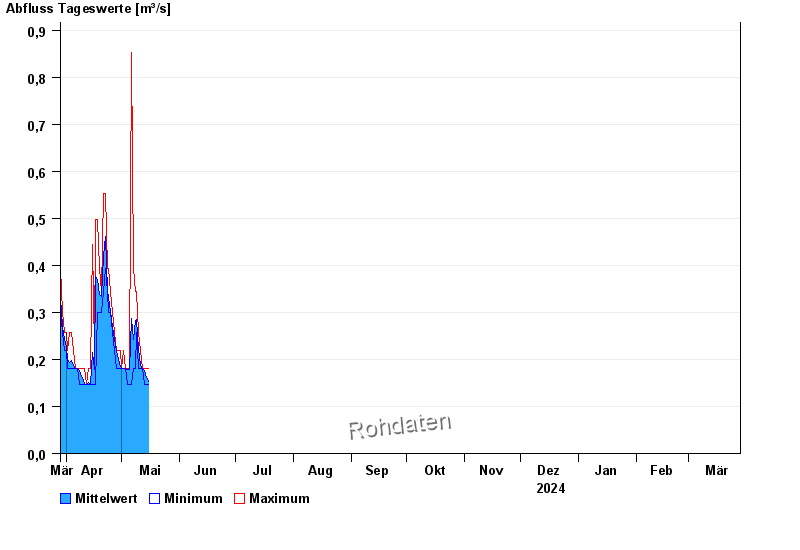
| Date | Mean value [m³/s] | Maximum [m³/s] | Minimum [m³/s] |
|---|---|---|---|
| 29.04.2024 | 0.195 | 0.218 | 0.18 |
| 28.04.2024 | 0.216 | 0.218 | 0.18 |
| 27.04.2024 | 0.242 | 0.258 | 0.218 |
| 26.04.2024 | 0.268 | 0.3 | 0.258 |
| 25.04.2024 | 0.302 | 0.345 | 0.3 |
| 24.04.2024 | 0.331 | 0.393 | 0.3 |
| 23.04.2024 | 0.347 | 0.393 | 0.345 |
© Bayerisches Landesamt für Umwelt 2024