
- Start >
- Rivers >
- Discharge >
- Isar >
- Großschwindau >
- Chart of year

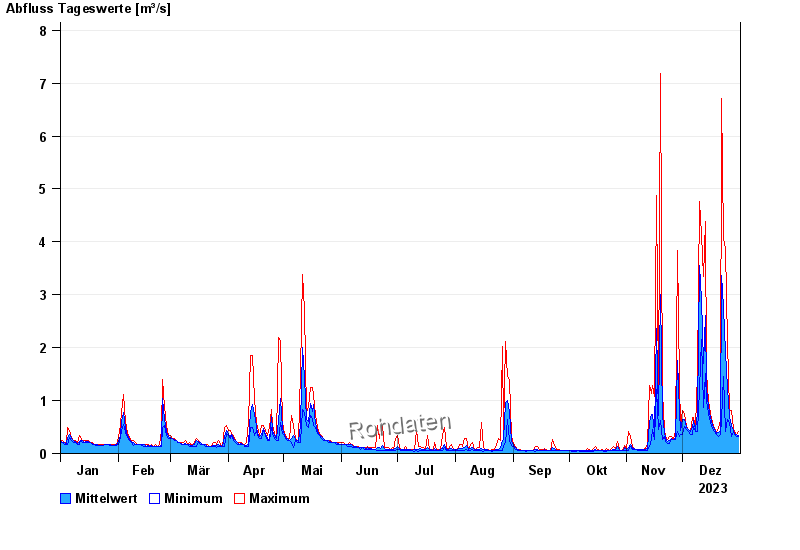
Chart of year Großschwindau / Goldach
Discharge from 01.01.2023 to 31.12.2023
| Date | Mean value [m³/s] | Maximum [m³/s] | Minimum [m³/s] |
|---|---|---|---|
| 31.12.2023 | 0.337 | 0.417 | 0.321 |
| 30.12.2023 | 0.352 | 0.367 | 0.321 |
| 29.12.2023 | 0.378 | 0.417 | 0.367 |
| 28.12.2023 | 0.438 | 0.47 | 0.417 |
| 27.12.2023 | 0.526 | 0.821 | 0.321 |
| 26.12.2023 | 0.699 | 0.821 | 0.581 |
| 25.12.2023 | 1.25 | 2.09 | 0.638 |
© Bayerisches Landesamt für Umwelt 2025