
- Start >
- Rivers >
- Discharge >
- Isar >
- Großschwindau >
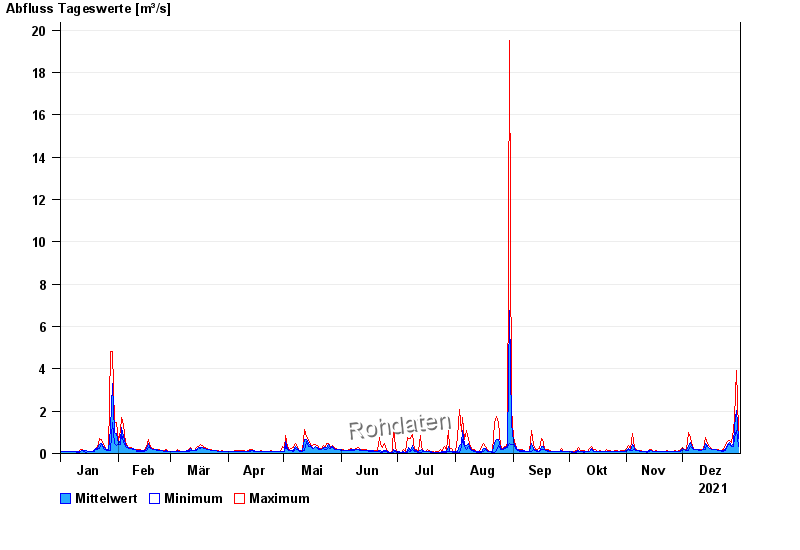
- Chart of year

Chart of year Großschwindau / Goldach
Discharge from 01.01.2021 to 31.12.2021
| Date | Mean value [m³/s] | Maximum [m³/s] | Minimum [m³/s] |
|---|---|---|---|
| 31.12.2021 | 0.717 | 1.08 | 0.321 |
| 30.12.2021 | 2.05 | 3.94 | 1.08 |
| 29.12.2021 | 1.28 | 1.67 | 0.754 |
| 28.12.2021 | 0.442 | 1.08 | 0.321 |
| 27.12.2021 | 0.4 | 0.523 | 0.321 |
| 26.12.2021 | 0.52 | 0.635 | 0.417 |
| 25.12.2021 | 0.417 | 0.578 | 0.368 |
© Bayerisches Landesamt für Umwelt 2025