
- Start >
- Rivers >
- Discharge >
- Isar >
- Großschwindau >
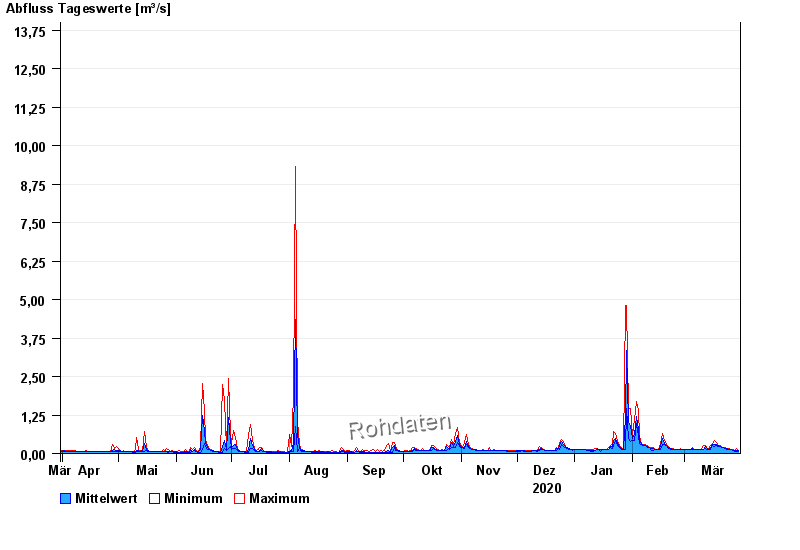
- Chart of year

Chart of year Großschwindau / Goldach
Discharge from 31.03.2020 to 30.03.2021
- 15.02.1990 Abfluss: 22,5 m³/s
- 03.08.1991 Abfluss: 22,1 m³/s
- 01.08.1991 Abfluss: 21,8 m³/s
- 09.06.1965 Abfluss: 20,1 m³/s
- 22.06.1965 Abfluss: 19,5 m³/s
| Date | Mean value [m³/s] | Maximum [m³/s] | Minimum [m³/s] |
|---|---|---|---|
| 30.03.2021 | 0.102 | 0.103 | 0.08 |
| 29.03.2021 | 0.101 | 0.16 | 0.08 |
| 28.03.2021 | 0.102 | 0.103 | 0.08 |
| 27.03.2021 | 0.109 | 0.13 | 0.103 |
| 26.03.2021 | 0.13 | 0.13 | 0.13 |
| 25.03.2021 | 0.133 | 0.16 | 0.13 |
| 24.03.2021 | 0.16 | 0.16 | 0.13 |
© Bayerisches Landesamt für Umwelt 2024