
- Start >
- Rivers >
- Discharge >
- Isar >
- Großschwindau >
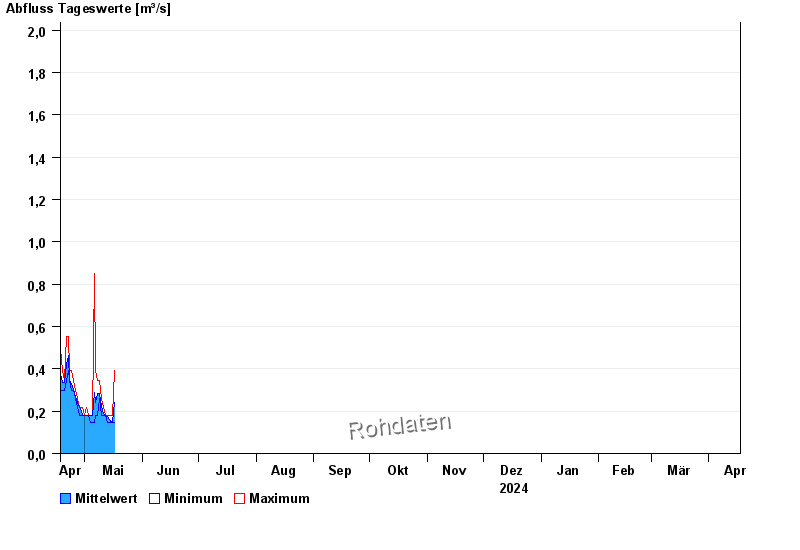
- Chart of year

Chart of year Großschwindau / Goldach
Discharge from 18.04.2024 to 17.04.2025
- HQ1 8,8 m³/s
- HQ2 11 m³/s
- HQ5 15 m³/s
- HQ10 19 m³/s
- HQ20 22 m³/s
- HQ50 26 m³/s
- HQ100 29 m³/s
| Date | Mean value [m³/s] | Maximum [m³/s] | Minimum [m³/s] |
|---|---|---|---|
| 30.04.2024 | 0.181 | 0.218 | 0.18 |
| 29.04.2024 | 0.199 | 0.218 | 0.18 |
| 28.04.2024 | 0.216 | 0.218 | 0.18 |
| 27.04.2024 | 0.242 | 0.258 | 0.218 |
| 26.04.2024 | 0.268 | 0.3 | 0.258 |
| 25.04.2024 | 0.302 | 0.345 | 0.3 |
| 24.04.2024 | 0.331 | 0.393 | 0.3 |
© Bayerisches Landesamt für Umwelt 2024