
- Start >
- Rivers >
- Discharge >
- Isar >
- Großschwindau >
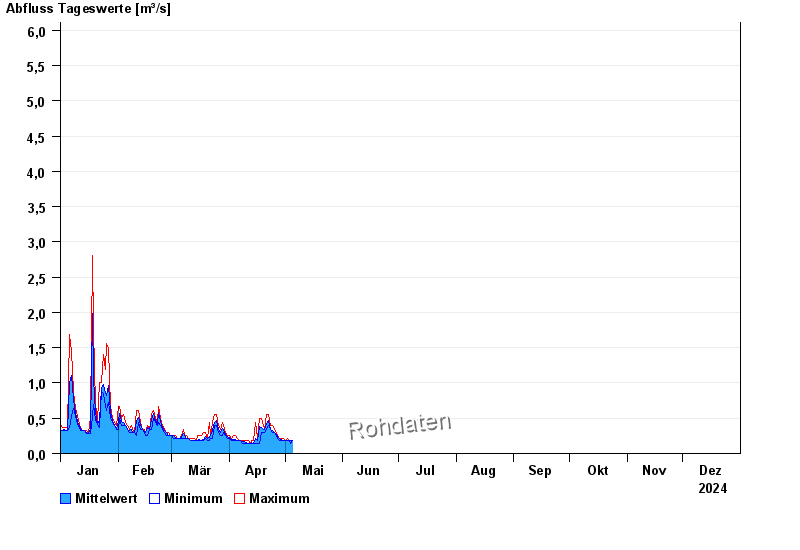
- Chart of year

Chart of year Großschwindau / Goldach
Discharge from 01.01.2024 to 31.12.2024
- HQ1 8,8 m³/s
- HQ2 11 m³/s
- HQ5 15 m³/s
- HQ10 19 m³/s
- HQ20 22 m³/s
- HQ50 26 m³/s
- HQ100 29 m³/s
| Date | Mean value [m³/s] | Maximum [m³/s] | Minimum [m³/s] |
|---|---|---|---|
| 17.05.2024 | 0.243 | 0.393 | 0.147 |
| 16.05.2024 | 0.153 | 0.18 | 0.147 |
| 15.05.2024 | 0.152 | 0.18 | 0.147 |
| 14.05.2024 | 0.162 | 0.18 | 0.147 |
| 13.05.2024 | 0.177 | 0.18 | 0.147 |
| 12.05.2024 | 0.18 | 0.18 | 0.18 |
| 11.05.2024 | 0.187 | 0.218 | 0.18 |
© Bayerisches Landesamt für Umwelt 2024