

Chart of year Griesen / Neidernach
Discharge from 01.01.2024 to 10.05.2024
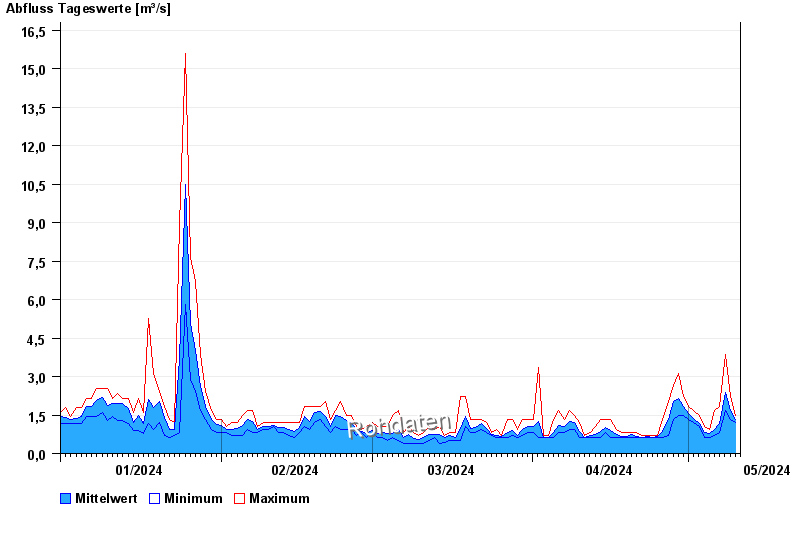
| Date | Mean value [m³/s] | Maximum [m³/s] | Minimum [m³/s] |
|---|---|---|---|
| 10.05.2024 | 1.4 | 1.5 | 1.34 |
| 09.05.2024 | 1.68 | 2.22 | 1.34 |
| 08.05.2024 | 2.37 | 3.85 | 1.66 |
| 07.05.2024 | 1.15 | 1.84 | 0.812 |
| 06.05.2024 | 0.947 | 1.66 | 0.706 |
| 05.05.2024 | 0.78 | 0.929 | 0.609 |
| 04.05.2024 | 0.817 | 1.06 | 0.609 |
© Bayerisches Landesamt für Umwelt 2024