

Chart of year Grafrath / Amper
Discharge from 23.09.2020 to 22.09.2021
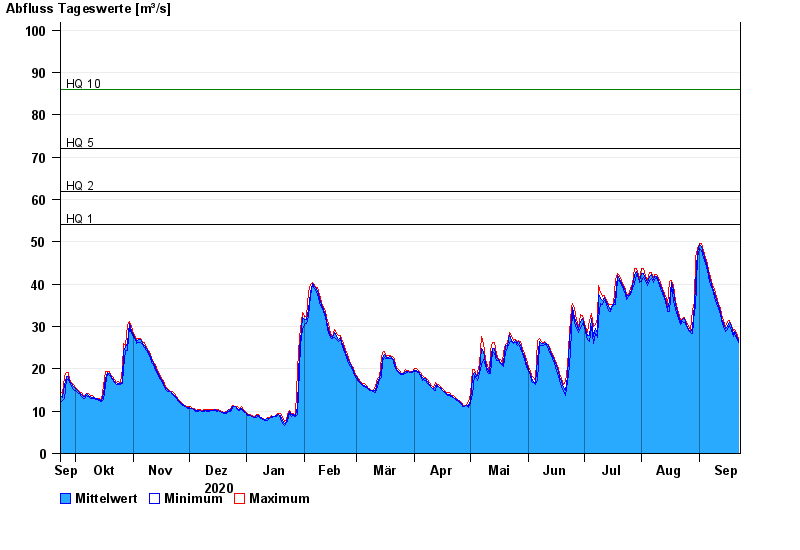
- HQ1 54 m³/s
- HQ2 62 m³/s
- HQ5 72 m³/s
- HQ10 86 m³/s
- HQ20 102 m³/s
- HQ50 125 m³/s
- HQ100 145 m³/s
| Date | Mean value [m³/s] | Maximum [m³/s] | Minimum [m³/s] |
|---|---|---|---|
| 22.09.2021 | 26.7 | 27.1 | 26.2 |
| 21.09.2021 | 27.9 | 28.7 | 27.1 |
| 20.09.2021 | 28.8 | 29.2 | 28.3 |
| 19.09.2021 | 28.1 | 29.1 | 27.6 |
| 18.09.2021 | 29.9 | 30.2 | 29.1 |
| 17.09.2021 | 31 | 31.5 | 30.2 |
| 16.09.2021 | 30 | 31.3 | 29.4 |
© Bayerisches Landesamt für Umwelt 2024