
- Start >
- Rivers >
- Discharge >
- Isar >
- Garmisch u. d. Partnachmündung >
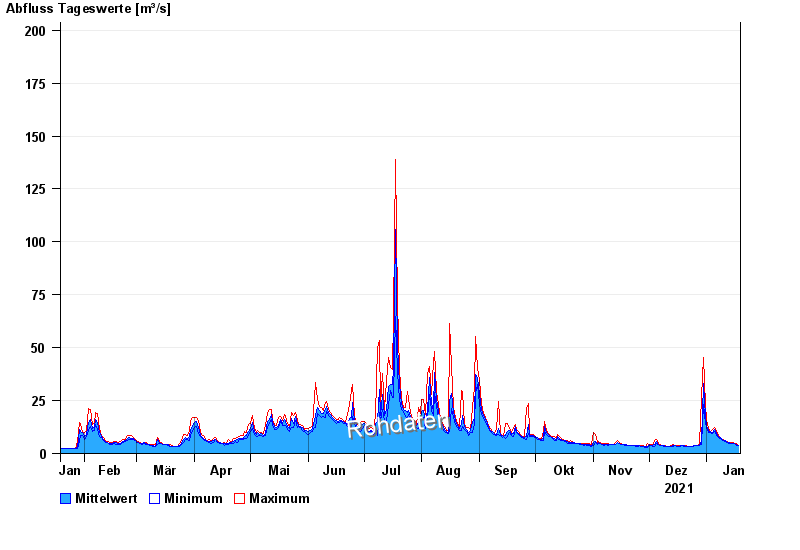
- Chart of year

Chart of year Garmisch u. d. Partnachmündung / Loisach
Discharge from 19.01.2021 to 18.01.2022
note
Messwerte beeinflusst durch Kraftwerkssteuerungen.
- 22.05.1999 Abfluss: 301 m³/s
- 31.05.1940 Abfluss: 245 m³/s
- 23.08.2005 Abfluss: 243 m³/s
- 23.08.1937 Abfluss: 215 m³/s
- 10.08.1970 Abfluss: 204 m³/s
| Date | Mean value [m³/s] | Maximum [m³/s] | Minimum [m³/s] |
|---|---|---|---|
| 18.01.2022 | 3.71 | 3.98 | 3.69 |
| 17.01.2022 | 4.18 | 4.53 | 3.98 |
| 16.01.2022 | 4.74 | 4.82 | 4.53 |
| 15.01.2022 | 4.89 | 5.11 | 4.82 |
| 14.01.2022 | 4.86 | 5.11 | 4.82 |
| 13.01.2022 | 5.1 | 5.11 | 4.82 |
| 12.01.2022 | 5.38 | 5.77 | 5.11 |
© Bayerisches Landesamt für Umwelt 2024