
- Start >
- Rivers >
- Discharge >
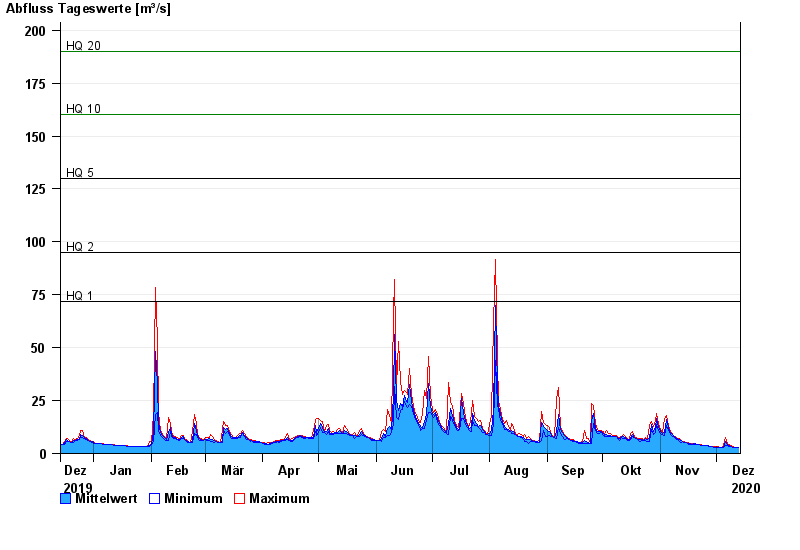
- Isar >
- Garmisch u. d. Partnachmündung >
- Chart of year

Chart of year Garmisch u. d. Partnachmündung / Loisach
Discharge from 14.12.2019 to 13.12.2020
note
Messwerte beeinflusst durch Kraftwerkssteuerungen.
- HQ1 72 m³/s
- HQ2 95 m³/s
- HQ5 130 m³/s
- HQ10 160 m³/s
- HQ20 190 m³/s
- HQ50 240 m³/s
- HQ100 270 m³/s
| Date | Mean value [m³/s] | Maximum [m³/s] | Minimum [m³/s] |
|---|---|---|---|
| 13.12.2020 | 2.85 | 2.85 | 2.85 |
| 12.12.2020 | 2.92 | 2.96 | 2.85 |
| 11.12.2020 | 2.96 | 2.96 | 2.96 |
| 10.12.2020 | 3.05 | 3.2 | 2.96 |
| 09.12.2020 | 3.35 | 3.92 | 3.2 |
| 08.12.2020 | 3.74 | 4.09 | 3.47 |
| 07.12.2020 | 4.18 | 4.66 | 3.76 |
© Bayerisches Landesamt für Umwelt 2024