
- Start >
- Rivers >
- Discharge >
- Isar >
- Garmisch u. d. Partnachmündung >
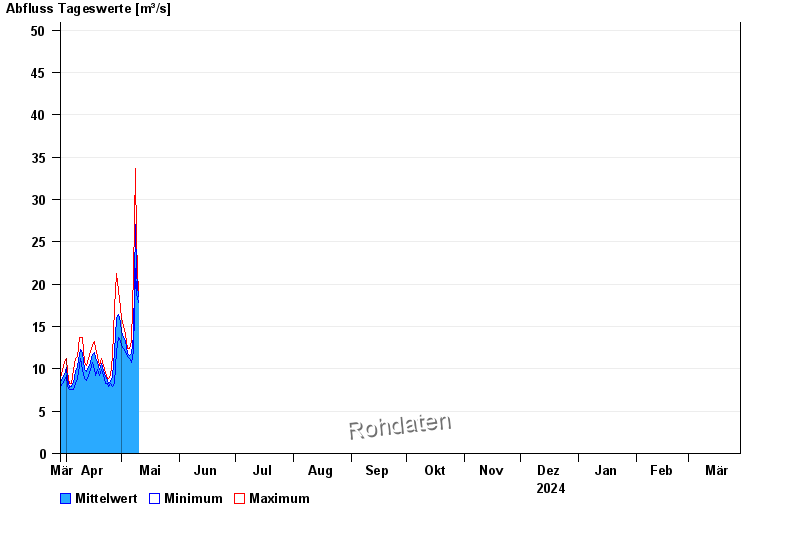
- Chart of year

Chart of year Garmisch u. d. Partnachmündung / Loisach
Discharge from 29.03.2024 to 28.03.2025
note
Messwerte beeinflusst durch Kraftwerkssteuerungen.
- 22.05.1999 Abfluss: 301 m³/s
- 31.05.1940 Abfluss: 245 m³/s
- 23.08.2005 Abfluss: 243 m³/s
- 23.08.1937 Abfluss: 215 m³/s
- 10.08.1970 Abfluss: 204 m³/s
| Date | Mean value [m³/s] | Maximum [m³/s] | Minimum [m³/s] |
|---|---|---|---|
| 27.04.2024 | 10.3 | 12.4 | 8.23 |
| 26.04.2024 | 9.14 | 11.5 | 7.89 |
| 25.04.2024 | 8.52 | 9.24 | 8.23 |
| 24.04.2024 | 8.31 | 8.88 | 7.89 |
| 23.04.2024 | 8.64 | 8.88 | 8.23 |
| 22.04.2024 | 9.15 | 9.6 | 8.23 |
| 21.04.2024 | 9.78 | 10.4 | 9.24 |
© Bayerisches Landesamt für Umwelt 2024