
- Start >
- Rivers >
- Discharge >
- Isar >
- Garmisch u. d. Partnachmündung >
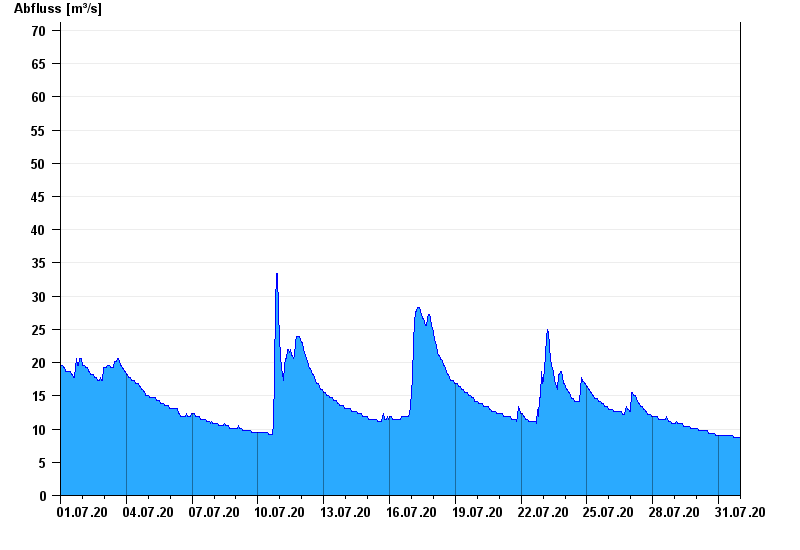
- Chart of month

Chart of month Garmisch u. d. Partnachmündung / Loisach
Discharge from 01.07.2020 to 31.07.2020
note
Messwerte beeinflusst durch Kraftwerkssteuerungen.
- HQ1 72 m³/s
- HQ2 95 m³/s
- HQ5 130 m³/s
- HQ10 160 m³/s
- HQ20 190 m³/s
- HQ50 240 m³/s
- HQ100 270 m³/s
| Date | Runoff [m³/s] |
|---|---|
| 01.08.2020 00:45 | 8.75 |
| 01.08.2020 00:30 | 8.75 |
| 01.08.2020 00:15 | 8.75 |
| 01.08.2020 00:00 | 8.75 |
| 31.07.2020 23:45 | 8.75 |
| 31.07.2020 23:30 | 8.75 |
| 31.07.2020 23:15 | 8.75 |
© Bayerisches Landesamt für Umwelt 2024