

Chart of total period Gaißach / Große Gaißach
Discharge from 01.11.1955 to 26.04.2024
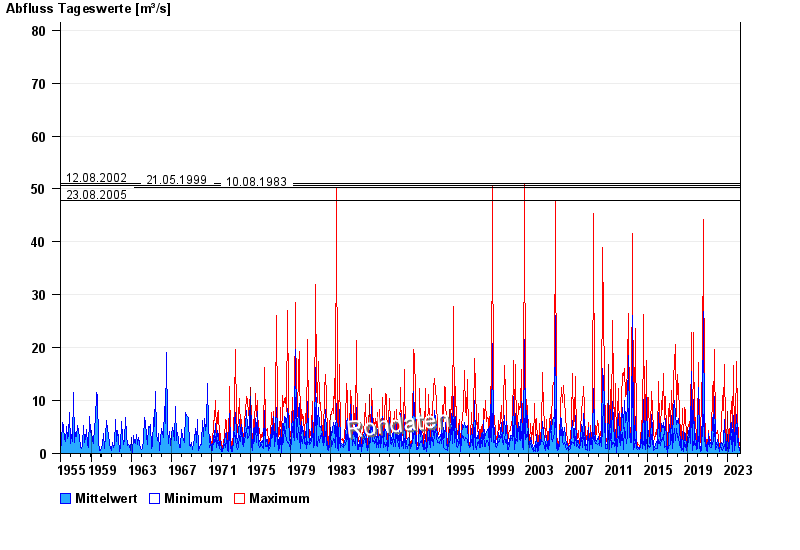
- 23.07.1966 Abfluss: 85 m³/s
- 12.08.2002 Abfluss: 51 m³/s
- 21.05.1999 Abfluss: 50,7 m³/s
- 10.08.1983 Abfluss: 50,3 m³/s
- 23.08.2005 Abfluss: 47,9 m³/s
| Date | Mean value [m³/s] | Maximum [m³/s] | Minimum [m³/s] |
|---|---|---|---|
| 26.04.2024 | 0.509 | 0.568 | 0.452 |
| 25.04.2024 | 0.571 | 0.706 | 0.507 |
| 24.04.2024 | 0.601 | 0.706 | 0.507 |
| 23.04.2024 | 0.672 | 0.706 | 0.634 |
| 22.04.2024 | 0.788 | 1.04 | 0.634 |
| 21.04.2024 | 0.867 | 1.04 | 0.706 |
| 20.04.2024 | 1.1 | 1.35 | 0.862 |
© Bayerisches Landesamt für Umwelt 2024