
- Start >
- Rivers >
- Discharge >
- Isar >
- Fürstenfeldbruck >
- Chart of year

Chart of year Fürstenfeldbruck / Amper
Discharge from 01.01.2019 to 31.12.2019
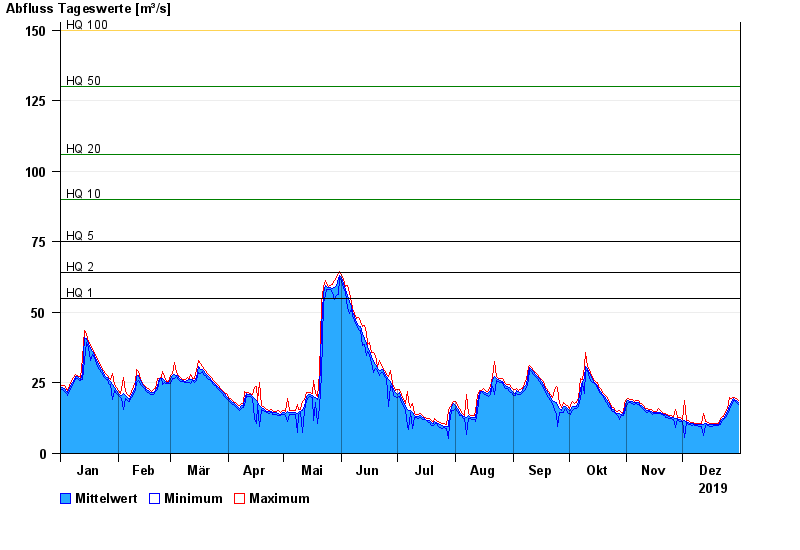
- HQ1 55 m³/s
- HQ2 64 m³/s
- HQ5 75 m³/s
- HQ10 90 m³/s
- HQ20 106 m³/s
- HQ50 130 m³/s
- HQ100 150 m³/s
| Date | Mean value [m³/s] | Maximum [m³/s] | Minimum [m³/s] |
|---|---|---|---|
| 31.12.2019 | 18.2 | 18.8 | 17.5 |
| 30.12.2019 | 18.8 | 19.4 | 18.2 |
| 29.12.2019 | 19.3 | 19.7 | 18.7 |
| 28.12.2019 | 19.4 | 19.8 | 18.9 |
| 27.12.2019 | 18.2 | 19.5 | 17 |
| 26.12.2019 | 17 | 19.8 | 15.7 |
| 25.12.2019 | 14.8 | 16 | 13.9 |
© Bayerisches Landesamt für Umwelt 2024