
- Start >
- Rivers >
- Discharge >
- Isar >
- Fürstenfeldbruck >
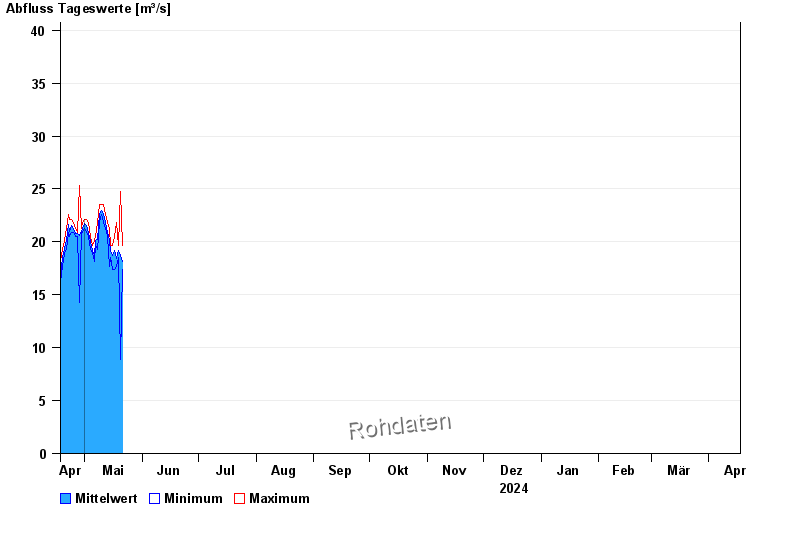
- Chart of year

Chart of year Fürstenfeldbruck / Amper
Discharge from 18.04.2024 to 17.04.2025
- 24.05.1999 Abfluss: 161 m³/s
- 03.06.1940 Abfluss: 140 m³/s
- 12.06.1965 Abfluss: 137 m³/s
- 21.06.1979 Abfluss: 108 m³/s
- 13.07.1954 Abfluss: 108 m³/s
| Date | Mean value [m³/s] | Maximum [m³/s] | Minimum [m³/s] |
|---|---|---|---|
| 17.05.2024 | 18.1 | 18.5 | 17.4 |
| 16.05.2024 | 18.7 | 19.7 | 17.4 |
| 15.05.2024 | 19.1 | 19.7 | 18.5 |
| 14.05.2024 | 20.1 | 21.3 | 17.7 |
| 13.05.2024 | 20.9 | 21.8 | 20.5 |
| 12.05.2024 | 21.8 | 22.6 | 21.3 |
| 11.05.2024 | 22.6 | 23.5 | 21.8 |
© Bayerisches Landesamt für Umwelt 2024