

Chart of year Freising / Schleifermoosach
Discharge from 01.03.2023 to 28.02.2024
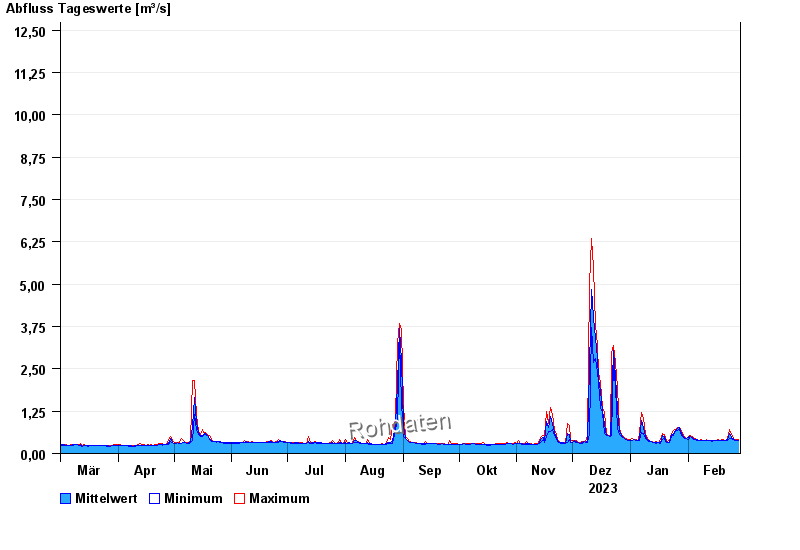 Für diesen Pegel sind keine Jährlichkeiten hinterlegt.
| Date | Mean value [m³/s] | Maximum [m³/s] | Minimum [m³/s] |
|---|---|---|---|
| 28.02.2024 | 0.389 | 0.423 | 0.389 |
| 27.02.2024 | 0.394 | 0.423 | 0.389 |
| 26.02.2024 | 0.419 | 0.423 | 0.389 |
| 25.02.2024 | 0.436 | 0.456 | 0.423 |
| 24.02.2024 | 0.486 | 0.557 | 0.456 |
| 23.02.2024 | 0.582 | 0.702 | 0.456 |
| 22.02.2024 | 0.406 | 0.456 | 0.389 |
© Bayerisches Landesamt für Umwelt 2024