
- Start >
- Rivers >
- Discharge >
- Isar >
- Eschenlohe Brücke >
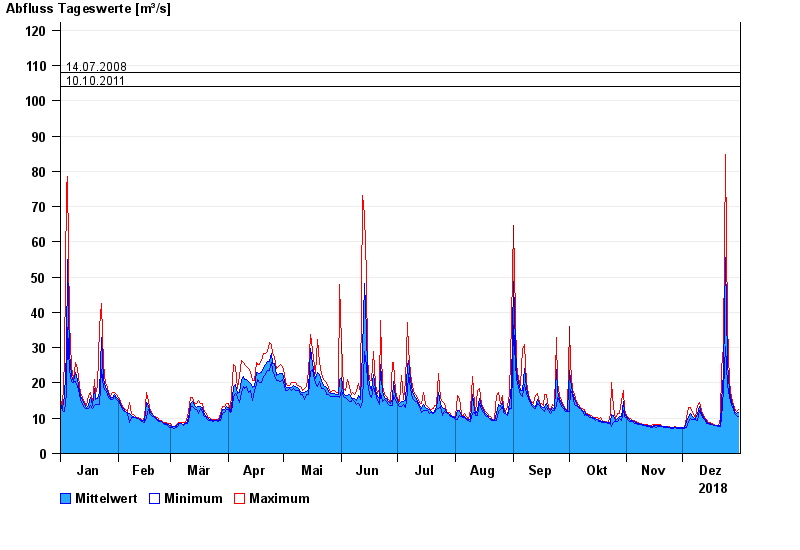
- Chart of year

Chart of year Eschenlohe Brücke / Loisach
Discharge from 01.01.2018 to 31.12.2018
note
Messwerte beeinflusst durch Kraftwerkssteuerungen.
- 02.06.2013 Abfluss: 203 m³/s
- 31.08.2010 Abfluss: 177 m³/s
- 03.06.2010 Abfluss: 172 m³/s
- 14.07.2008 Abfluss: 108 m³/s
- 10.10.2011 Abfluss: 104 m³/s
| Date | Mean value [m³/s] | Maximum [m³/s] | Minimum [m³/s] |
|---|---|---|---|
| 31.12.2018 | 11.5 | 12.5 | 10.5 |
| 30.12.2018 | 11.4 | 11.8 | 10.9 |
| 29.12.2018 | 11.9 | 12.7 | 11.4 |
| 28.12.2018 | 13.2 | 14 | 12.7 |
| 27.12.2018 | 14.7 | 15.9 | 13.6 |
| 26.12.2018 | 17.6 | 20.1 | 15.9 |
| 25.12.2018 | 25.7 | 36.5 | 19.5 |
© Bayerisches Landesamt für Umwelt 2024