

Chart of month Eching / Windach
Discharge from 01.12.2020 to 31.12.2020
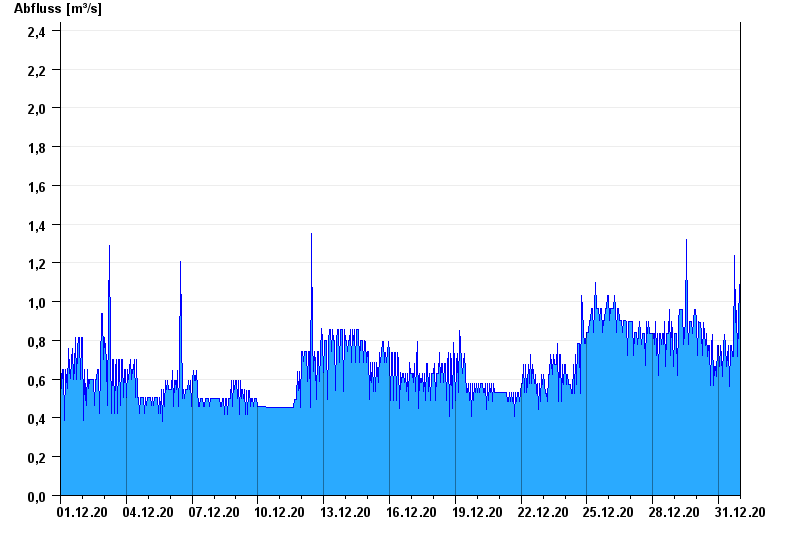
note
Pegel beeinflusst durch Kraftwerkssteuerung
- 02.06.2013 Abfluss: 48 m³/s
- 06.01.2013 Abfluss: 19,8 m³/s
- 23.10.2014 Abfluss: 19,3 m³/s
- 02.02.2013 Abfluss: 13,9 m³/s
- 22.01.2012 Abfluss: 11,7 m³/s
| Date | Runoff [m³/s] |
|---|---|
| 31.12.2020 23:45 | 0.956 |
| 31.12.2020 23:30 | 0.36 |
| 31.12.2020 23:15 | 0.267 |
| 31.12.2020 23:00 | 0.326 |
| 31.12.2020 22:45 | 0.564 |
| 31.12.2020 22:30 | 1.09 |
| 31.12.2020 22:15 | 0.475 |
© Bayerisches Landesamt für Umwelt 2024