

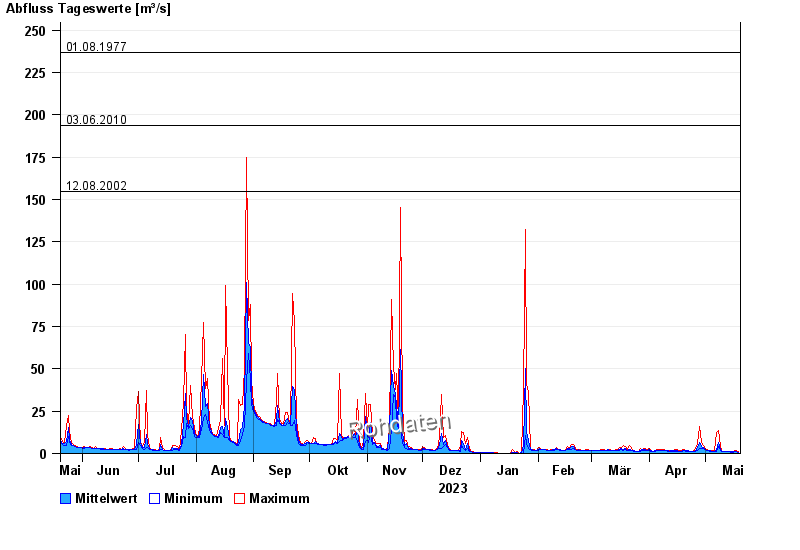
Chart of year Dürrach / Dürrach
Discharge from 20.05.2023 to 19.05.2024
Beeinflussung
Wasserstand durch starke Aufkiesung beeinflusst, der Abfluss ist ungültig
- 23.08.2005 Abfluss: 349 m³/s
- 22.05.1999 Abfluss: 291 m³/s
- 01.08.1977 Abfluss: 237 m³/s
- 03.06.2010 Abfluss: 194 m³/s
- 12.08.2002 Abfluss: 155 m³/s
| Date | Mean value [m³/s] | Maximum [m³/s] | Minimum [m³/s] |
|---|---|---|---|
| 10.05.2024 | 1.5 | 1.73 | 1.38 |
| 09.05.2024 | 2.61 | 4.85 | 1.73 |
| 08.05.2024 | 6.31 | 13.7 | 4.14 |
| 07.05.2024 | 2.47 | 12.3 | 1.31 |
| 06.05.2024 | 1.36 | 1.55 | 1.17 |
| 05.05.2024 | 1.34 | 1.55 | 1.17 |
| 04.05.2024 | 1.49 | 1.63 | 1.31 |
© Bayerisches Landesamt für Umwelt 2024