

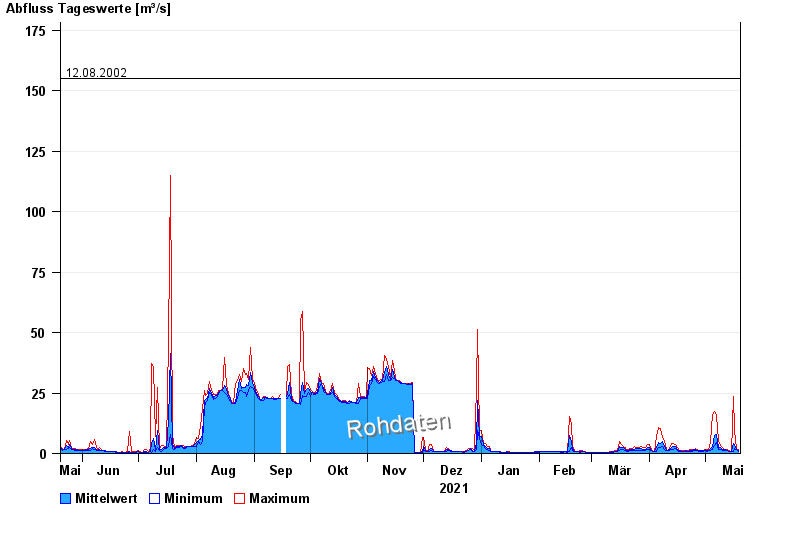
Chart of year Dürrach / Dürrach
Discharge from 20.05.2021 to 19.05.2022
Beeinflussung
Wasserstand durch starke Aufkiesung beeinflusst, der Abfluss ist ungültig
- 23.08.2005 Abfluss: 349 m³/s
- 22.05.1999 Abfluss: 291 m³/s
- 01.08.1977 Abfluss: 237 m³/s
- 03.06.2010 Abfluss: 194 m³/s
- 12.08.2002 Abfluss: 155 m³/s
| Date | Mean value [m³/s] | Maximum [m³/s] | Minimum [m³/s] |
|---|---|---|---|
| 19.05.2022 | 1.32 | 1.55 | 1.02 |
| 18.05.2022 | 1.68 | 2 | 1.55 |
| 17.05.2022 | 3.68 | 9.57 | 2 |
| 16.05.2022 | 4.3 | 23.4 | 0.732 |
| 15.05.2022 | 0.882 | 1.02 | 0.732 |
| 14.05.2022 | 1.02 | 1.21 | 0.936 |
| 13.05.2022 | 1.33 | 1.7 | 1.11 |
© Bayerisches Landesamt für Umwelt 2024