

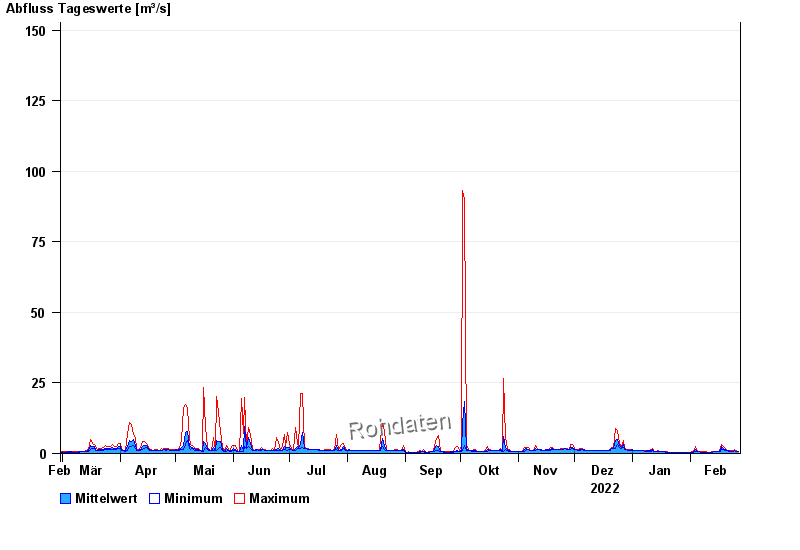
Chart of year Dürrach / Dürrach
Discharge from 28.02.2022 to 27.02.2023
Beeinflussung
Wasserstand durch starke Aufkiesung beeinflusst, der Abfluss ist ungültig
- 23.08.2005 Abfluss: 349 m³/s
- 22.05.1999 Abfluss: 291 m³/s
- 01.08.1977 Abfluss: 237 m³/s
- 03.06.2010 Abfluss: 194 m³/s
- 12.08.2002 Abfluss: 155 m³/s
| Date | Mean value [m³/s] | Maximum [m³/s] | Minimum [m³/s] |
|---|---|---|---|
| 27.02.2023 | 0.73 | 0.762 | 0.692 |
| 26.02.2023 | 0.835 | 0.936 | 0.762 |
| 25.02.2023 | 1.2 | 1.55 | 0.936 |
| 24.02.2023 | 0.853 | 1.04 | 0.802 |
| 23.02.2023 | 0.862 | 0.888 | 0.844 |
| 22.02.2023 | 0.889 | 0.988 | 0.844 |
| 21.02.2023 | 1.01 | 1.16 | 0.936 |
© Bayerisches Landesamt für Umwelt 2024