

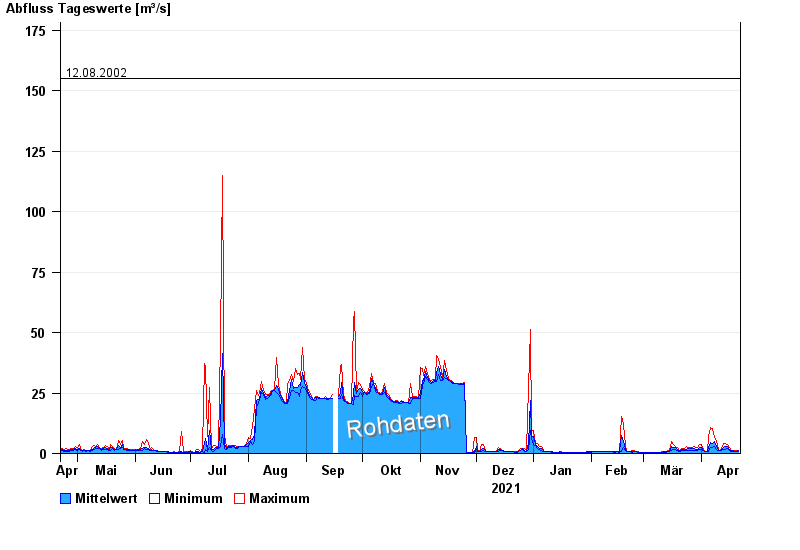
Chart of year Dürrach / Dürrach
Discharge from 22.04.2021 to 21.04.2022
Beeinflussung
Wasserstand durch starke Aufkiesung beeinflusst, der Abfluss ist ungültig
- 23.08.2005 Abfluss: 349 m³/s
- 22.05.1999 Abfluss: 291 m³/s
- 01.08.1977 Abfluss: 237 m³/s
- 03.06.2010 Abfluss: 194 m³/s
- 12.08.2002 Abfluss: 155 m³/s
| Date | Mean value [m³/s] | Maximum [m³/s] | Minimum [m³/s] |
|---|---|---|---|
| 21.04.2022 | 1.06 | 1.37 | 0.91 |
| 20.04.2022 | 1.03 | 1.26 | 0.91 |
| 19.04.2022 | 0.998 | 1.16 | 0.91 |
| 18.04.2022 | 1.06 | 1.26 | 0.91 |
| 17.04.2022 | 1.12 | 1.26 | 0.987 |
| 16.04.2022 | 1.71 | 2.64 | 1.26 |
| 15.04.2022 | 2.88 | 3.62 | 2.08 |
© Bayerisches Landesamt für Umwelt 2024