

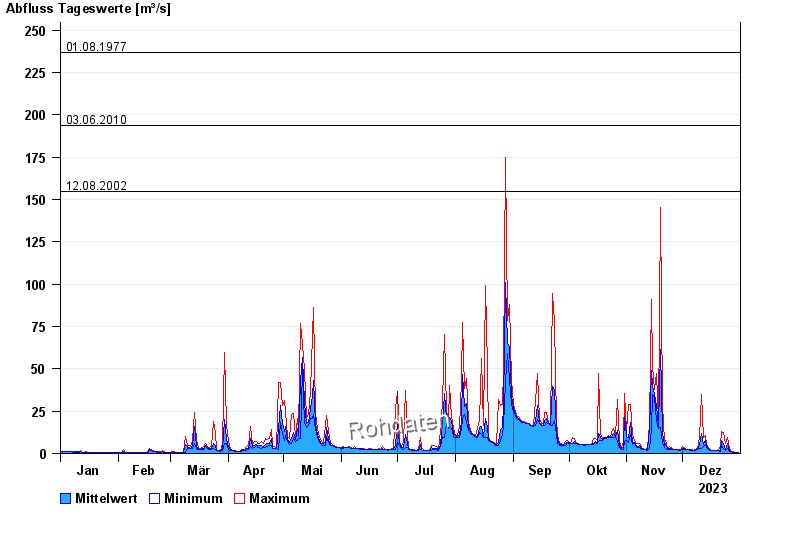
Chart of year Dürrach / Dürrach
Discharge from 01.01.2023 to 31.12.2023
Beeinflussung
Wasserstand durch starke Aufkiesung beeinflusst, der Abfluss ist ungültig
- 23.08.2005 Abfluss: 349 m³/s
- 22.05.1999 Abfluss: 291 m³/s
- 01.08.1977 Abfluss: 237 m³/s
- 03.06.2010 Abfluss: 194 m³/s
- 12.08.2002 Abfluss: 155 m³/s
| Date | Mean value [m³/s] | Maximum [m³/s] | Minimum [m³/s] |
|---|---|---|---|
| 31.12.2023 | 0.566 | 0.697 | 0.537 |
| 30.12.2023 | 0.641 | 0.697 | 0.617 |
| 29.12.2023 | 0.706 | 0.781 | 0.697 |
| 28.12.2023 | 0.822 | 0.946 | 0.781 |
| 27.12.2023 | 1.07 | 1.21 | 0.946 |
| 26.12.2023 | 1.8 | 2.77 | 1.3 |
| 25.12.2023 | 5.97 | 9.59 | 2.77 |
© Bayerisches Landesamt für Umwelt 2024