

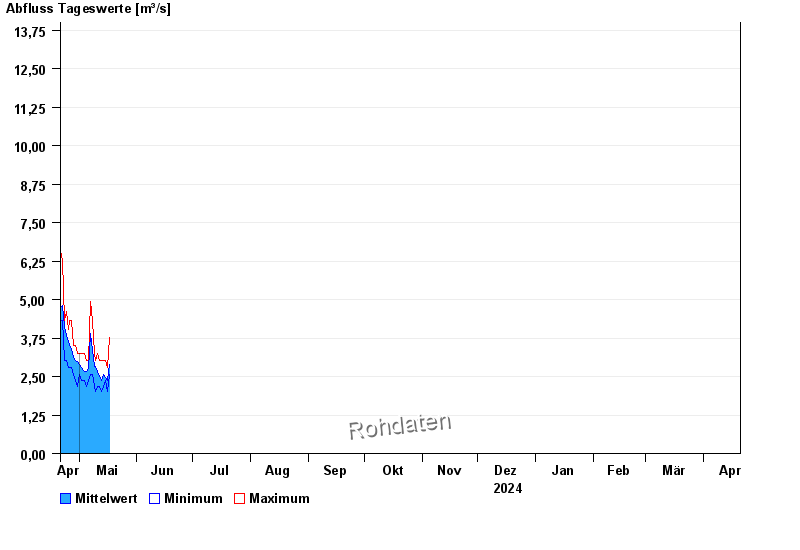
Chart of year Druisheim / Schmutter
Discharge from 21.04.2024 to 20.04.2025
- HQ1 26 m³/s
- HQ2 30 m³/s
- HQ5 45 m³/s
- HQ10 55 m³/s
- HQ20 66 m³/s
- HQ50 81 m³/s
- HQ100 90 m³/s
| Date | Mean value [m³/s] | Maximum [m³/s] | Minimum [m³/s] |
|---|---|---|---|
| 03.05.2024 | 2.76 | 3.01 | 2.36 |
| 02.05.2024 | 2.79 | 3.24 | 2.36 |
| 01.05.2024 | 2.88 | 3.24 | 2.56 |
| 30.04.2024 | 2.98 | 3.24 | 2.18 |
| 29.04.2024 | 3.01 | 3.5 | 2.36 |
| 28.04.2024 | 3.11 | 3.5 | 2.56 |
| 27.04.2024 | 3.37 | 4.32 | 2.78 |
© Bayerisches Landesamt für Umwelt 2024