
- Start >
- Rivers >
- Discharge >
- Isar >
- Burghausen >
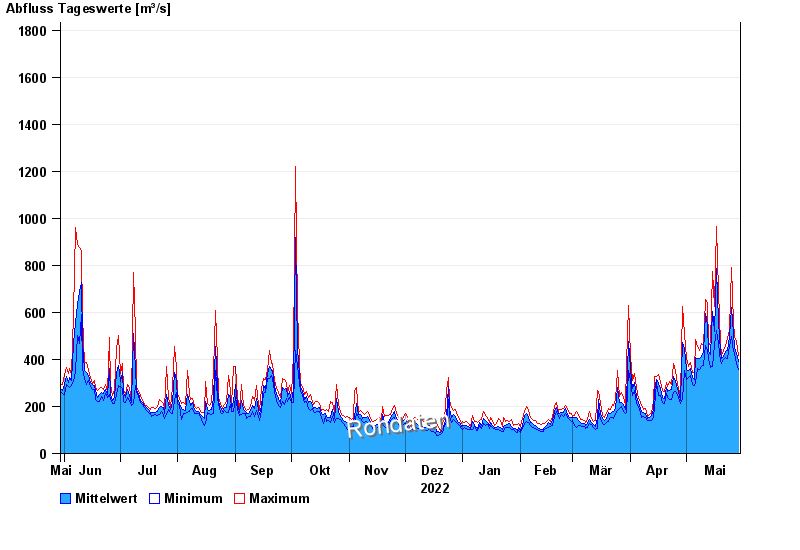
- Chart of year

Chart of year Burghausen / Salzach
Discharge from 30.05.2022 to 29.05.2023
- 03.06.2013 Abfluss: 4000 m³/s
- 14.09.1899 Abfluss: 3350 m³/s
- 08.09.1920 Abfluss: 3150 m³/s
- 13.08.2002 Abfluss: 3100 m³/s
- 14.08.1959 Abfluss: 3010 m³/s
| Date | Mean value [m³/s] | Maximum [m³/s] | Minimum [m³/s] |
|---|---|---|---|
| 29.05.2023 | 391 | 417 | 358 |
| 28.05.2023 | 424 | 476 | 384 |
| 27.05.2023 | 451 | 496 | 425 |
| 26.05.2023 | 510 | 559 | 433 |
| 25.05.2023 | 620 | 790 | 499 |
| 24.05.2023 | 498 | 526 | 456 |
| 23.05.2023 | 439 | 488 | 403 |
© Bayerisches Landesamt für Umwelt 2024