
- Start >
- Rivers >
- Discharge >
- Isar >
- Burghausen >
- Chart of year

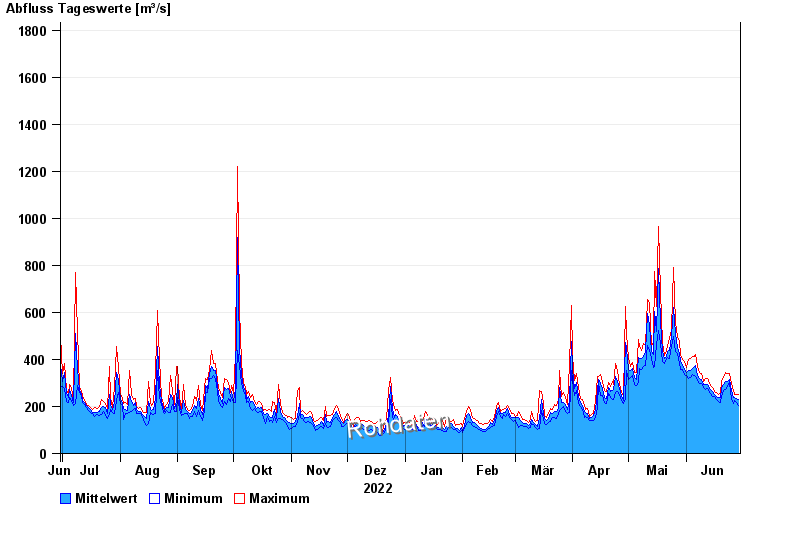
Chart of year Burghausen / Salzach
Discharge from 30.06.2022 to 29.06.2023
- 03.06.2013 Abfluss: 4000 m³/s
- 14.09.1899 Abfluss: 3350 m³/s
- 08.09.1920 Abfluss: 3150 m³/s
- 13.08.2002 Abfluss: 3100 m³/s
- 14.08.1959 Abfluss: 3010 m³/s
| Date | Mean value [m³/s] | Maximum [m³/s] | Minimum [m³/s] |
|---|---|---|---|
| 29.06.2023 | 231 | 249 | 206 |
| 28.06.2023 | 236 | 251 | 217 |
| 27.06.2023 | 239 | 253 | 225 |
| 26.06.2023 | 238 | 267 | 211 |
| 25.06.2023 | 266 | 298 | 229 |
| 24.06.2023 | 316 | 339 | 300 |
| 23.06.2023 | 307 | 341 | 284 |
© Bayerisches Landesamt für Umwelt 2024