
- Start >
- Rivers >
- Discharge >
- Isar >
- Burghausen >
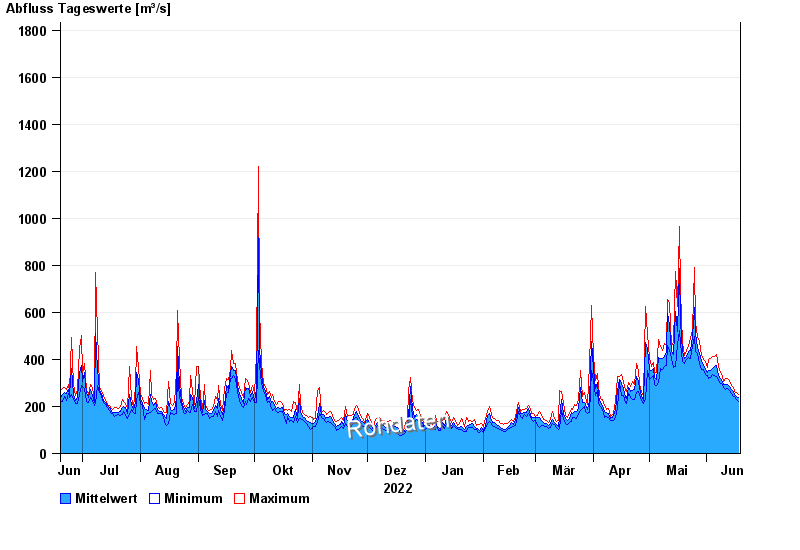
- Chart of year

Chart of year Burghausen / Salzach
Discharge from 19.06.2022 to 18.06.2023
- 03.06.2013 Abfluss: 4000 m³/s
- 14.09.1899 Abfluss: 3350 m³/s
- 08.09.1920 Abfluss: 3150 m³/s
- 13.08.2002 Abfluss: 3100 m³/s
- 14.08.1959 Abfluss: 3010 m³/s
| Date | Mean value [m³/s] | Maximum [m³/s] | Minimum [m³/s] |
|---|---|---|---|
| 18.06.2023 | 237 | 253 | 219 |
| 17.06.2023 | 244 | 258 | 229 |
| 16.06.2023 | 249 | 264 | 243 |
| 15.06.2023 | 262 | 280 | 243 |
| 14.06.2023 | 271 | 289 | 256 |
| 13.06.2023 | 286 | 310 | 269 |
| 12.06.2023 | 292 | 320 | 275 |
© Bayerisches Landesamt für Umwelt 2024