
- Start >
- Rivers >
- Discharge >
- Isar >
- Burghausen >
- Chart of year

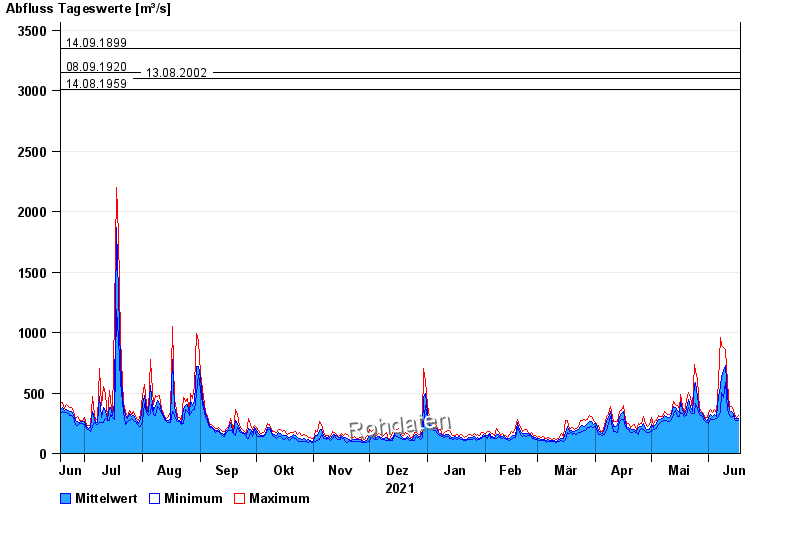
Chart of year Burghausen / Salzach
Discharge from 18.06.2021 to 17.06.2022
- 03.06.2013 Abfluss: 4000 m³/s
- 14.09.1899 Abfluss: 3350 m³/s
- 08.09.1920 Abfluss: 3150 m³/s
- 13.08.2002 Abfluss: 3100 m³/s
- 14.08.1959 Abfluss: 3010 m³/s
| Date | Mean value [m³/s] | Maximum [m³/s] | Minimum [m³/s] |
|---|---|---|---|
| 17.06.2022 | 290 | 311 | 274 |
| 16.06.2022 | 292 | 299 | 272 |
| 15.06.2022 | 301 | 323 | 285 |
| 14.06.2022 | 331 | 353 | 311 |
| 13.06.2022 | 346 | 387 | 295 |
| 12.06.2022 | 355 | 384 | 318 |
| 11.06.2022 | 472 | 584 | 363 |
© Bayerisches Landesamt für Umwelt 2024