
- Start >
- Rivers >
- Discharge >
- Isar >
- Burghausen >
- Chart of year

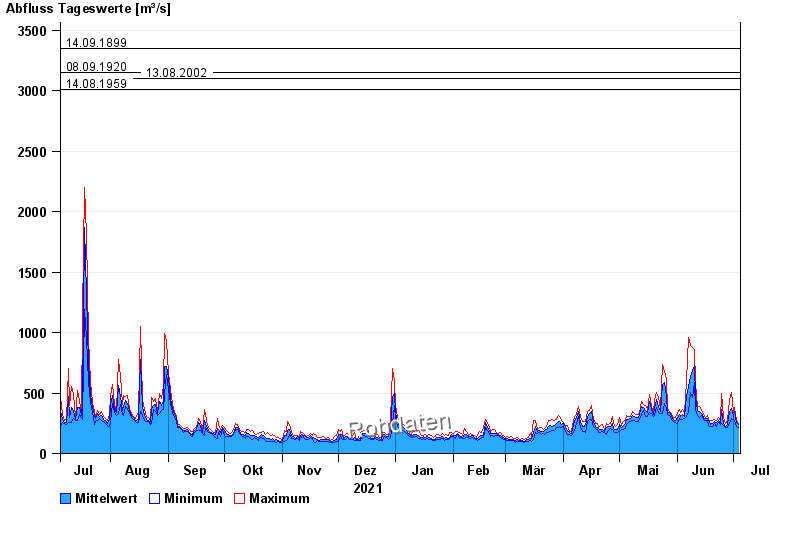
Chart of year Burghausen / Salzach
Discharge from 05.07.2021 to 04.07.2022
- 03.06.2013 Abfluss: 4000 m³/s
- 14.09.1899 Abfluss: 3350 m³/s
- 08.09.1920 Abfluss: 3150 m³/s
- 13.08.2002 Abfluss: 3100 m³/s
- 14.08.1959 Abfluss: 3010 m³/s
| Date | Mean value [m³/s] | Maximum [m³/s] | Minimum [m³/s] |
|---|---|---|---|
| 04.07.2022 | 237 | 250 | 215 |
| 03.07.2022 | 254 | 274 | 223 |
| 02.07.2022 | 345 | 381 | 276 |
| 01.07.2022 | 306 | 342 | 285 |
| 30.06.2022 | 374 | 502 | 288 |
| 29.06.2022 | 342 | 447 | 250 |
| 28.06.2022 | 239 | 272 | 212 |
© Bayerisches Landesamt für Umwelt 2024