
- Start >
- Rivers >
- Discharge >
- Isar >
- Beyharting >
- Chart of year

Chart of year Beyharting / Glonn
Discharge from 28.01.2021 to 27.01.2022
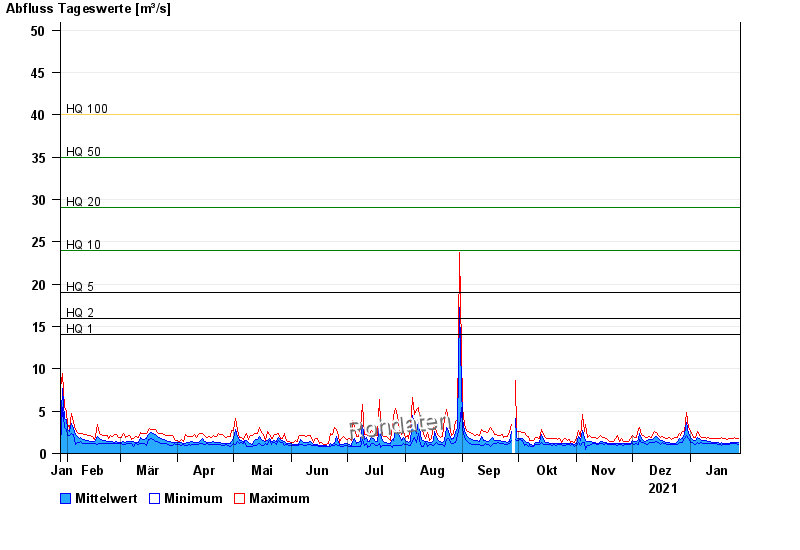
- HQ1 14 m³/s
- HQ2 16 m³/s
- HQ5 19 m³/s
- HQ10 24 m³/s
- HQ20 29 m³/s
- HQ50 35 m³/s
- HQ100 40 m³/s
| Date | Mean value [m³/s] | Maximum [m³/s] | Minimum [m³/s] |
|---|---|---|---|
| 27.01.2022 | 1.31 | 1.83 | 1.12 |
| 26.01.2022 | 1.32 | 1.83 | 1.19 |
| 25.01.2022 | 1.33 | 1.92 | 1.19 |
| 24.01.2022 | 1.34 | 1.83 | 1.19 |
| 23.01.2022 | 1.33 | 1.83 | 1.19 |
| 22.01.2022 | 1.23 | 1.83 | 1.12 |
| 21.01.2022 | 1.21 | 1.66 | 1.12 |
© Bayerisches Landesamt für Umwelt 2024