
- Start >
- Rivers >
- Discharge >
- Isar >
- Beyharting >
- Chart of year

Chart of year Beyharting / Glonn
Discharge from 29.05.2021 to 28.05.2022
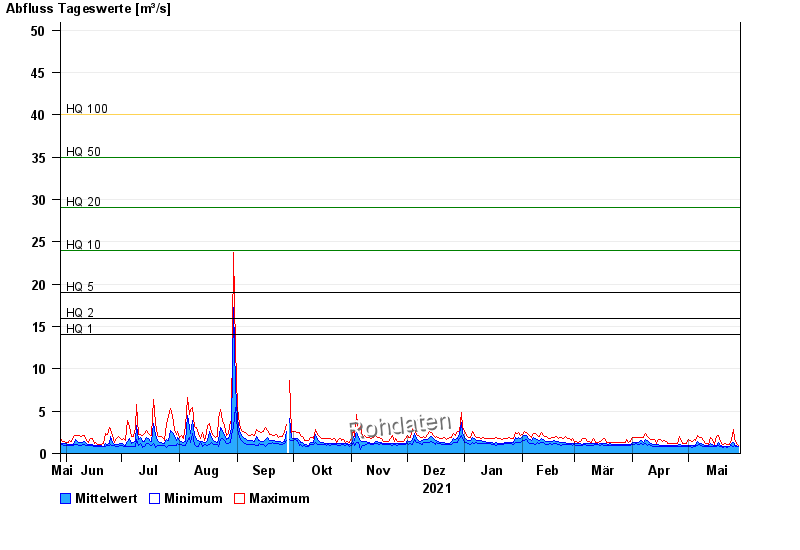
- HQ1 14 m³/s
- HQ2 16 m³/s
- HQ5 19 m³/s
- HQ10 24 m³/s
- HQ20 29 m³/s
- HQ50 35 m³/s
- HQ100 40 m³/s
| Date | Mean value [m³/s] | Maximum [m³/s] | Minimum [m³/s] |
|---|---|---|---|
| 28.05.2022 | 0.879 | 1 | 0.797 |
| 27.05.2022 | 0.935 | 1.14 | 0.861 |
| 26.05.2022 | 1.09 | 1.69 | 0.93 |
| 25.05.2022 | 1.31 | 2.78 | 0.861 |
| 24.05.2022 | 1.13 | 1.69 | 0.93 |
| 23.05.2022 | 0.857 | 1.07 | 0.797 |
| 22.05.2022 | 0.852 | 1.07 | 0.731 |
© Bayerisches Landesamt für Umwelt 2024