

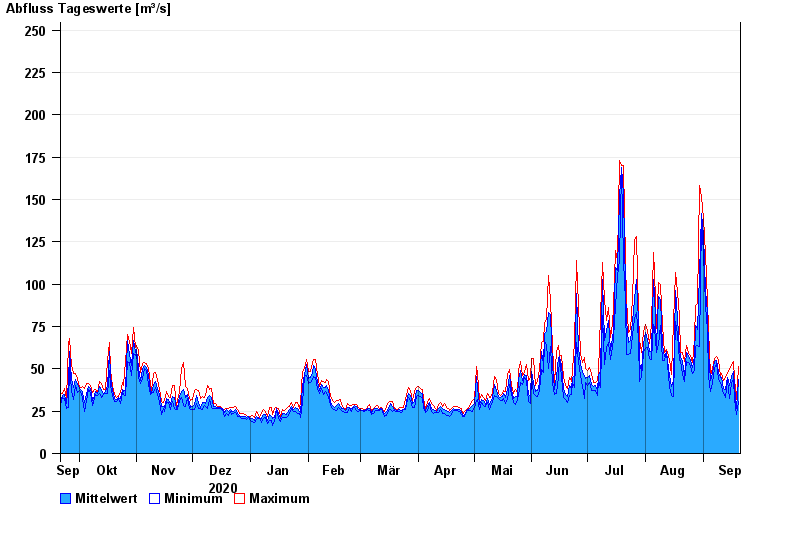
Chart of year Beuerberg / Loisach
Discharge from 21.09.2020 to 20.09.2021
- 24.05.1999 Abfluss: 319 m³/s
- 23.08.2005 Abfluss: 310 m³/s
- 03.06.2013 Abfluss: 300 m³/s
- 10.08.1970 Abfluss: 281 m³/s
- 18.06.1979 Abfluss: 280 m³/s
| Date | Mean value [m³/s] | Maximum [m³/s] | Minimum [m³/s] |
|---|---|---|---|
| 20.09.2021 | 43.5 | 51.4 | 30.5 |
| 19.09.2021 | 26.4 | 32.1 | 23.2 |
| 18.09.2021 | 39.4 | 43.8 | 32.1 |
| 17.09.2021 | 48.2 | 54.3 | 43.8 |
| 16.09.2021 | 45.7 | 52.8 | 41.1 |
| 15.09.2021 | 40.3 | 49.9 | 32.7 |
| 14.09.2021 | 44.7 | 47.1 | 43 |
© Bayerisches Landesamt für Umwelt 2024