

Chart of year Beuerberg / Loisach
Discharge from 17.10.2023 to 16.10.2024
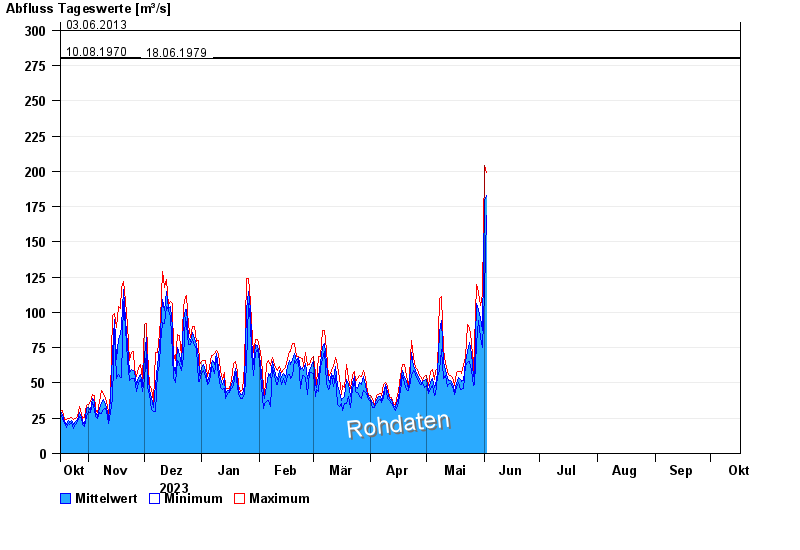
- 24.05.1999 Abfluss: 319 m³/s
- 23.08.2005 Abfluss: 310 m³/s
- 03.06.2013 Abfluss: 300 m³/s
- 10.08.1970 Abfluss: 281 m³/s
- 18.06.1979 Abfluss: 280 m³/s
| Date | Mean value [m³/s] | Maximum [m³/s] | Minimum [m³/s] |
|---|---|---|---|
| 09.05.2024 | 95.1 | 111 | 73.5 |
| 08.05.2024 | 85.7 | 110 | 59.1 |
| 07.05.2024 | 57 | 59.8 | 54.5 |
| 06.05.2024 | 48 | 59.1 | 41.5 |
| 05.05.2024 | 46.9 | 52.4 | 40.8 |
| 04.05.2024 | 53.3 | 59.8 | 48.2 |
| 03.05.2024 | 51.2 | 58.3 | 46.1 |
© Bayerisches Landesamt für Umwelt 2024