
- Start >
- Rivers >
- Discharge >
- Isar >
- Bergkirchen >
- Chart of total period

Chart of total period Bergkirchen / Maisach
Discharge from 01.11.1935 to 26.04.2024
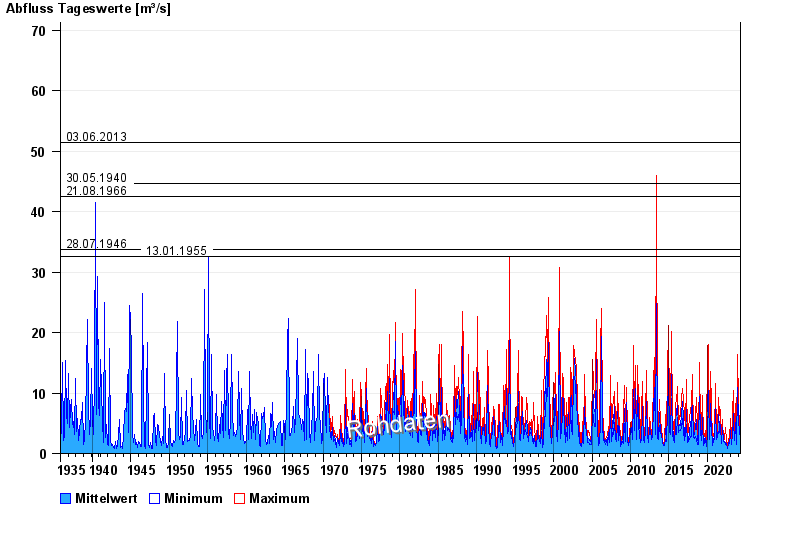
- 03.06.2013 Abfluss: 51,5 m³/s
- 30.05.1940 Abfluss: 44,7 m³/s
- 21.08.1966 Abfluss: 42,5 m³/s
- 28.07.1946 Abfluss: 33,8 m³/s
- 13.01.1955 Abfluss: 32,6 m³/s
| Date | Mean value [m³/s] | Maximum [m³/s] | Minimum [m³/s] |
|---|---|---|---|
| 26.04.2024 | 2.33 | 2.33 | 2.33 |
| 25.04.2024 | 2.42 | 2.43 | 2.33 |
| 24.04.2024 | 2.45 | 2.54 | 2.43 |
| 23.04.2024 | 2.51 | 2.54 | 2.43 |
| 22.04.2024 | 2.55 | 2.65 | 2.43 |
| 21.04.2024 | 2.59 | 2.65 | 2.54 |
| 20.04.2024 | 2.66 | 2.76 | 2.65 |
© Bayerisches Landesamt für Umwelt 2024