

Chart of year Bairawies / Zeller Bach
Discharge from 19.10.2021 to 18.10.2022
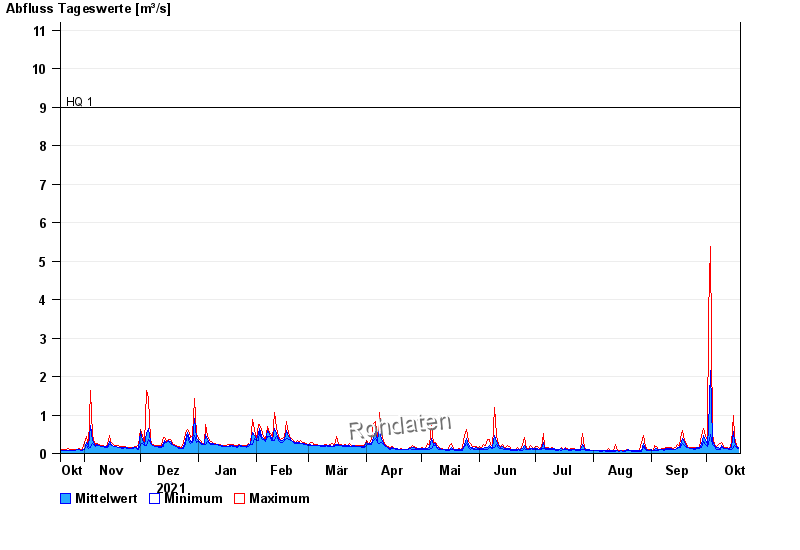
- HQ1 9 m³/s
- HQ2 12 m³/s
- HQ5 16 m³/s
- HQ10 20 m³/s
- HQ20 24 m³/s
- HQ50 30 m³/s
- HQ100 35 m³/s
| Date | Mean value [m³/s] | Maximum [m³/s] | Minimum [m³/s] |
|---|---|---|---|
| 18.10.2022 | 0.146 | 0.163 | 0.124 |
| 17.10.2022 | 0.183 | 0.208 | 0.163 |
| 16.10.2022 | 0.286 | 0.415 | 0.208 |
| 15.10.2022 | 0.566 | 1 | 0.143 |
| 14.10.2022 | 0.144 | 0.285 | 0.109 |
| 13.10.2022 | 0.123 | 0.124 | 0.109 |
| 12.10.2022 | 0.127 | 0.143 | 0.124 |
© Bayerisches Landesamt für Umwelt 2024