

Chart of year Bairawies / Zeller Bach
Discharge from 01.01.2023 to 31.12.2023
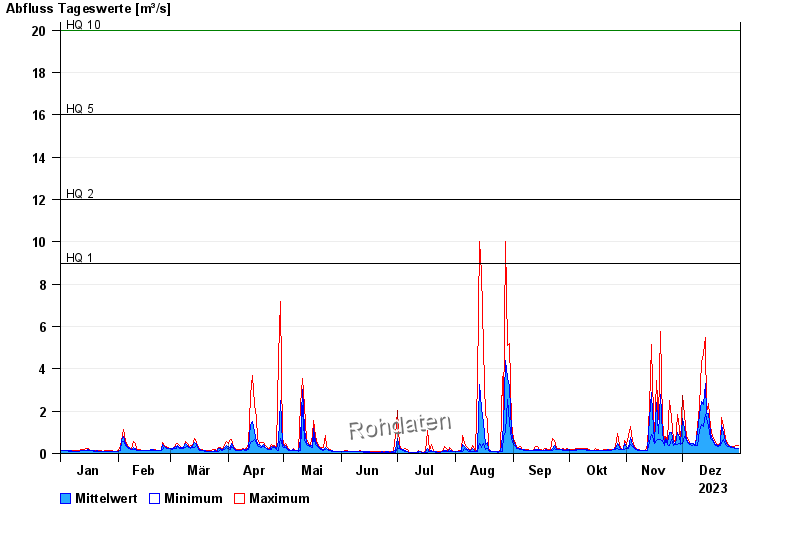
- HQ1 9 m³/s
- HQ2 12 m³/s
- HQ5 16 m³/s
- HQ10 20 m³/s
- HQ20 24 m³/s
- HQ50 30 m³/s
- HQ100 35 m³/s
| Date | Mean value [m³/s] | Maximum [m³/s] | Minimum [m³/s] |
|---|---|---|---|
| 31.12.2023 | 0.23 | 0.392 | 0.214 |
| 30.12.2023 | 0.253 | 0.392 | 0.214 |
| 29.12.2023 | 0.263 | 0.314 | 0.245 |
| 28.12.2023 | 0.28 | 0.314 | 0.279 |
| 27.12.2023 | 0.31 | 0.314 | 0.279 |
| 26.12.2023 | 0.339 | 0.392 | 0.314 |
| 25.12.2023 | 0.415 | 0.485 | 0.351 |
© Bayerisches Landesamt für Umwelt 2025