
- Start >
- Rivers >
- Discharge >
- Isar >
- Bad Wiessee >
- Chart of year

Chart of year Bad Wiessee / Söllbach
Discharge from 24.01.2020 to 23.01.2021
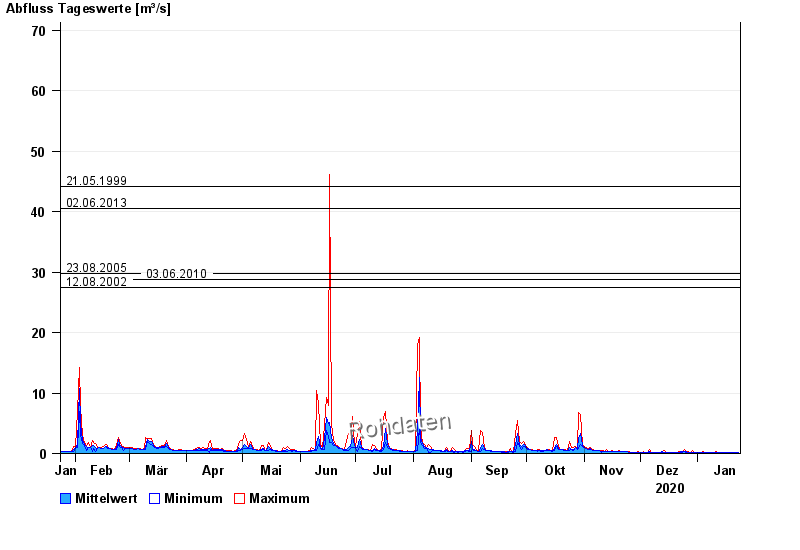
- 21.05.1999 Abfluss: 44,1 m³/s
- 02.06.2013 Abfluss: 40,5 m³/s
- 23.08.2005 Abfluss: 29,8 m³/s
- 03.06.2010 Abfluss: 28,7 m³/s
- 12.08.2002 Abfluss: 27,4 m³/s
| Date | Mean value [m³/s] | Maximum [m³/s] | Minimum [m³/s] |
|---|---|---|---|
| 23.01.2021 | 0.143 | 0.151 | 0.127 |
| 22.01.2021 | 0.125 | 0.127 | 0.107 |
| 21.01.2021 | 0.103 | 0.127 | 0.088 |
| 20.01.2021 | 0.104 | 0.107 | 0.088 |
| 19.01.2021 | 0.106 | 0.107 | 0.088 |
| 18.01.2021 | 0.106 | 0.107 | 0.088 |
| 17.01.2021 | 0.107 | 0.107 | 0.107 |
© Bayerisches Landesamt für Umwelt 2024