
- Start >
- Rivers >
- Discharge >
- Isar >
- Bad Wiessee >
- Chart of year

Chart of year Bad Wiessee / Söllbach
Discharge from 07.05.2020 to 06.05.2021
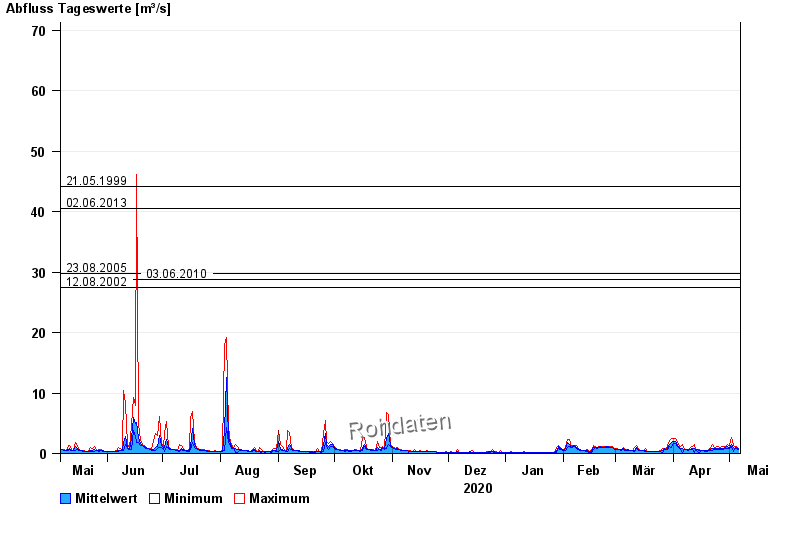
- 21.05.1999 Abfluss: 44,1 m³/s
- 02.06.2013 Abfluss: 40,5 m³/s
- 23.08.2005 Abfluss: 29,8 m³/s
- 03.06.2010 Abfluss: 28,7 m³/s
- 12.08.2002 Abfluss: 27,4 m³/s
| Date | Mean value [m³/s] | Maximum [m³/s] | Minimum [m³/s] |
|---|---|---|---|
| 06.05.2021 | 0.766 | 0.905 | 0.734 |
| 05.05.2021 | 1.01 | 1.2 | 0.817 |
| 04.05.2021 | 0.889 | 1.09 | 0.734 |
| 03.05.2021 | 0.949 | 1.3 | 0.359 |
| 02.05.2021 | 1.55 | 2.7 | 1.09 |
| 01.05.2021 | 1.03 | 1.3 | 0.817 |
| 30.04.2021 | 1.13 | 1.54 | 0.905 |
© Bayerisches Landesamt für Umwelt 2024