
- Start >
- Rivers >
- Discharge >
- Isar >
- Bad Wiessee >
- Chart of year

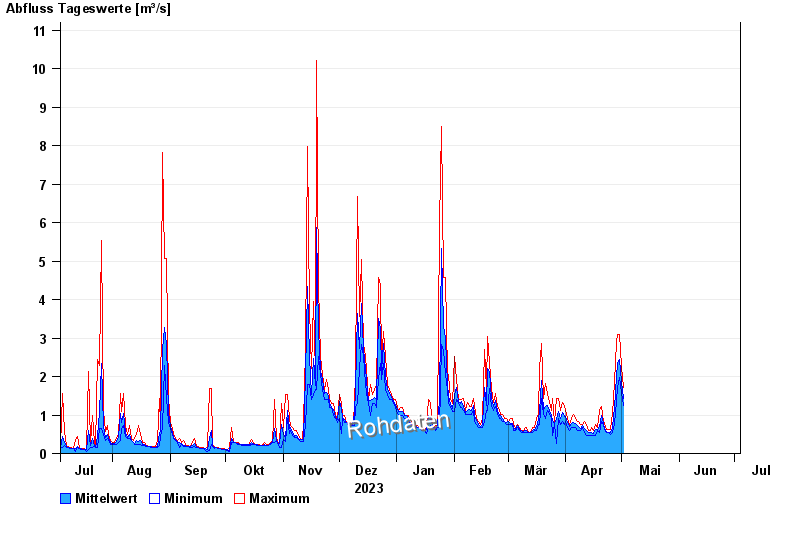
Chart of year Bad Wiessee / Söllbach
Discharge from 04.07.2023 to 03.07.2024
| Date | Mean value [m³/s] | Maximum [m³/s] | Minimum [m³/s] |
|---|---|---|---|
| 17.05.2024 | 0.609 | 0.691 | 0.552 |
| 16.05.2024 | 0.518 | 0.552 | 0.49 |
| 15.05.2024 | 0.571 | 0.618 | 0.552 |
| 14.05.2024 | 0.622 | 0.691 | 0.552 |
| 13.05.2024 | 0.629 | 0.767 | 0.552 |
| 12.05.2024 | 0.636 | 0.691 | 0.552 |
| 11.05.2024 | 0.733 | 1.13 | 0.691 |
© Bayerisches Landesamt für Umwelt 2024