
- Start >
- Rivers >
- Discharge >
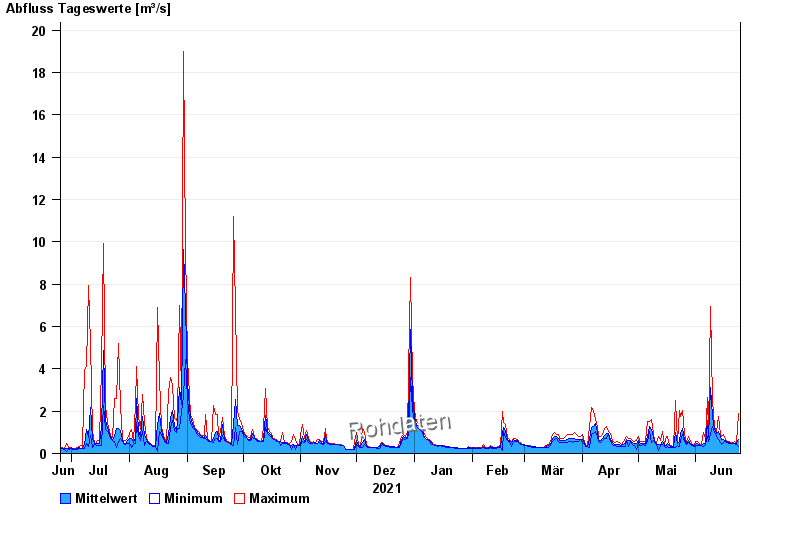
- Isar >
- Bad Wiessee >
- Chart of year

Chart of year Bad Wiessee / Söllbach
Discharge from 25.06.2021 to 24.06.2022
| Date | Mean value [m³/s] | Maximum [m³/s] | Minimum [m³/s] |
|---|---|---|---|
| 24.06.2022 | 0.643 | 1.9 | 0.312 |
| 23.06.2022 | 0.456 | 0.514 | 0.403 |
| 22.06.2022 | 0.49 | 0.577 | 0.455 |
| 21.06.2022 | 0.469 | 0.514 | 0.455 |
| 20.06.2022 | 0.488 | 0.514 | 0.455 |
| 19.06.2022 | 0.515 | 0.577 | 0.455 |
| 18.06.2022 | 0.545 | 0.577 | 0.514 |
© Bayerisches Landesamt für Umwelt 2024